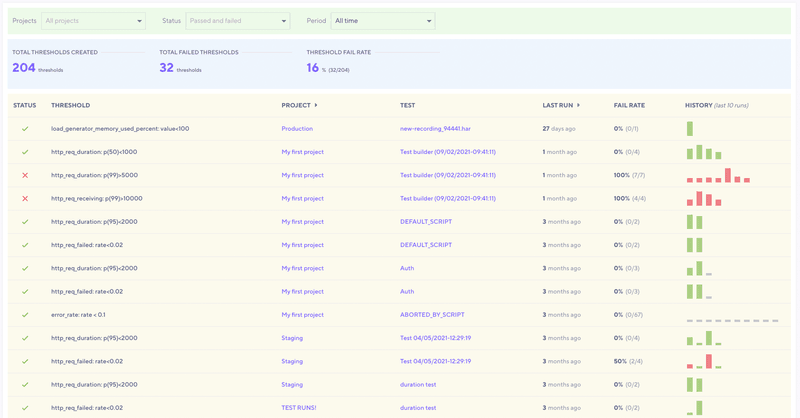
You can track and manage all your organization’s thresholds. You can easily find tests with failing thresholds, check which project they belong to, their current status and history, and whether patterns need your attention.
To manage thresholds, under Manage in the sidebar, select Thresholds.
The Thresholds page has a few sections:
Filtering section (highlighted in green)
This is where you can narrow down the results by filtering by: Projects, Status and Period.
Overview section (highlighted in blue)
In this section you see the overview numbers of all your organization's thresholds.
Threshold listing (highlighted yellow)
Here are the thresholds and their accompanying data.
| Column | Description |
|---|---|
| Status | Current status of the threshold as per its last test run indicated by a checkmark ✓ or cross ✗ for pass or fail respectively. |
| Threshold | Threshold metric name and criteria. |
| Project | The project that the threshold test belongs to to. |
| Test | The name of the test of the threshold with a link to its most recent run. |
| Last run | The time the test last ran run. |
| Fail rate | Number of threshold failures against the total number of times the threshold was used. |
| History | Chart that visualizes the threshold results for the last 10 test runs. |
