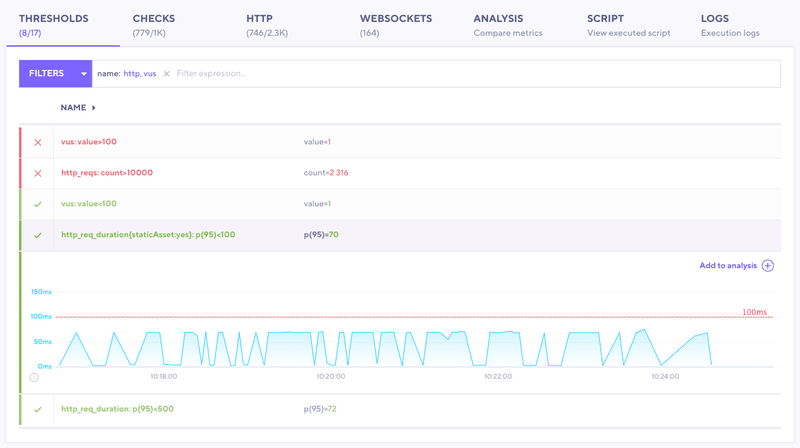
With thresholds, you can set pass/fail criteria for your test metrics. Often testers use thresholds to codify their service-level objectives.
ⓘ If a threshold fails, k6 marks the test as Failed in the UI.
Pass/Fail criteria in a test
By analyzing your threshold data, you can discover whether your test passed or failed the metric objectives that you set.
If a threshold fails, you can use the Thresholds tab to analyze its trends across the test duration and iterations.
Explore thresholds in k6 Cloud
To visually inspect and analyze thresholds, use the Threshold tab.
First, in the tab itself, note the number of the thresholds that passed against the total number of thresholds. This number can let you know whether the tab is worth exploring.
Then, you can explore the data from individual thresholds. You can use this tab to do the following investigations.
To find failing thresholds, use the search bar. You can filter by name or by pass/fail status.
Search for one or multiple names, like http or vus.
From your filters, find which thresholds. For example, vus: value>100 and http_reqs:count>10000.
Note the ✓ or ✕ on the left side of each row.
To see visualizations for the metric, select the threshold.
Use the graph to inspect when performance degraded.
In our example below, the expanded thresholds has a value below the threshold of 100 ms.
To compare a threshold time series to other metrics, add the row to the Analysis tab.
Compare threshold metrics with other time series
To compare the threshold with other data about the test:
- Select the threshold.
- Select Add to analysis.
- Then use the Analysis tab to find correlations between threshold data and other values from the test.
