With the Dynatrace k6 extension, you can send visualize and correlate performance testing metrics with the other metrics that you monitor in Dynatrace.
Build the k6 version
To build a k6 binary with the extension, first, ensure you have installed Go and Git; the following steps are:
xk6 will create the k6 binary in the local folder.
To learn more about how to build custom k6 versions, check out xk6.
Run the test
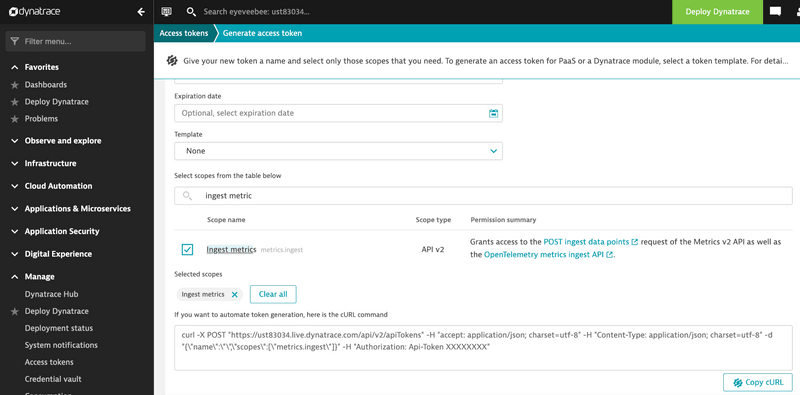
Create a Dynatrace API token to send the data.
attentionThe Dynatrace API Token must have the scope name "metrics.ingest" (scope type `API v2`).
You can use the Dynatrace UI:
Or a curl command (replace <environment-id> and the Api-Token):
Use the previously built k6 binary and run the test passing the Dynatrace URL and API token as follows:
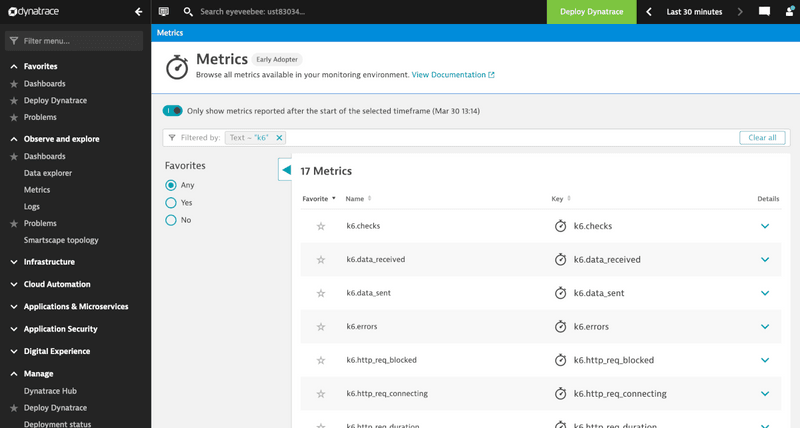
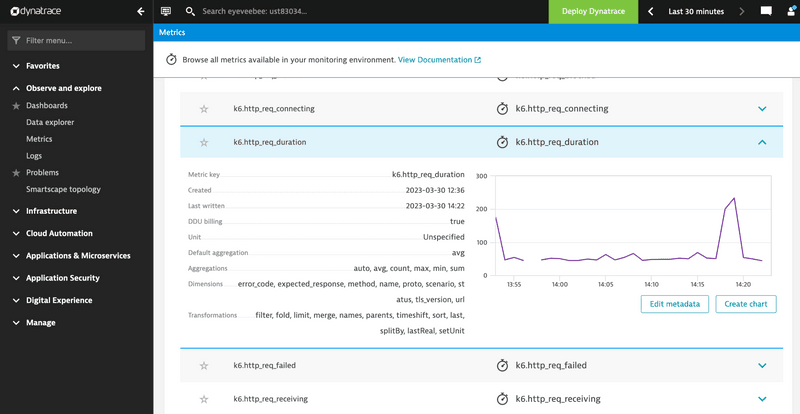
Check the metrics in your Dynatrace environment, filtering for k6:
Options
When streaming the k6 results to Dynatrace, you can configure the following Dynatrace options:
| Name | Value |
|---|---|
| K6_DYNATRACE_APITOKEN | Dynatrace API token to write the metrics. The token must have the scope metrics.ingest API v2. |
| K6_DYNATRACE_FLUSH_PERIOD | Define how often metrics are sent to Dynatrace. The default value is 1 second. |
| K6_DYNATRACE_URL | Dynatrace URL. The default value is https://dynatrace.live.com. |
| K6_DYNATRACE_INSECURE_SKIP_TLS_VERIFY | If true, the HTTP client skips TLS verification on the endpoint. The default value is true. |
| K6_DYNATRACE_HEADER_<here-the-header-key> | Additional headers to include in the HTTP requests. K6_DYNATRACE_HEADER_COOL_HEADER="cool value of the header" |


