Using the Elasticsearch k6 extension, you can store k6 metrics in Elasticsearch and analyze your performance results with Kibana or Grafana.
Build the k6 version
To build a k6 binary with the extension, first, ensure you have installed Go and Git; the following steps are:
xk6 will create the k6 binary in the local folder.
To learn more about how to build custom k6 versions, check out xk6.
Run the test
Check that the Elasticsearch instance to store the k6 metrics is running.
If you're running on Elasticsearch cloud, use the previous k6 binary and run the test passing the cloud credentials as follows:
k6 runs the test script and sends the metrics in real-time to Elasticsearch.
You can also send the metrics to a local Elasticsearch cluster:
attentionSecurity and self-signed certificates for non-cloud clusters are not yet supported.
You can now connect to Elasticsearch and query the k6 metrics stored in the k6-metrics index. The following example uses an unsecured local Elasticsearch, version 7.17.9:
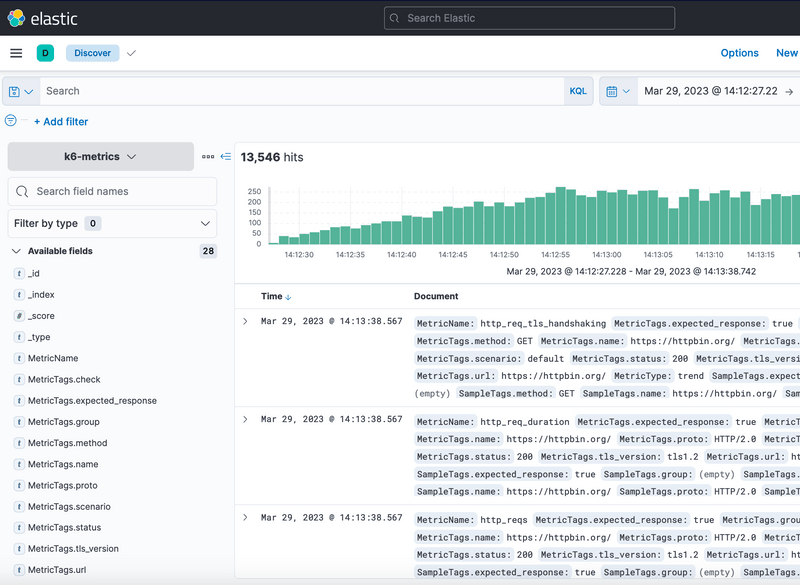
Or use Kibana Discover:
Options
Here is the full list of options that can be configured and passed to the extension:
| Name | Value |
|---|---|
| K6_ELASTICSEARCH_CLOUD_ID | Elasticsearch cloud.id, which can be found in the Elastic Cloud web console. |
| K6_ELASTICSEARCH_FLUSH_PERIOD | Define how often metrics are sent to Elasticsearch. The default value is 1 second. |
| K6_ELASTICSEARCH_URL | Elasticsearch URL. |
| K6_ELASTICSEARCH_USER | Elasticsearch username. |
| K6_ELASTICSEARCH_PASSWORD | Elasticsearch password. |
