warningThe built-in StatsD output has been deprecated on k6 v0.47.0. You can continue to use this feature by using the xk6-output-statsd extension, and this guide has been updated to include instructions for how to use it.
For more information on the reason behind this change, you can follow this issue in the k6 repository.
k6 can send metrics data to Amazon CloudWatch through the CloudWatch Agent by using the xk6-output-statsd extension. These metrics can then be visualized in dashboards.
This guide covers how to:
- Run the CloudWatch agent
- Run the k6 test
- Visualize k6 metrics in Amazon CloudWatch
Before you begin
To use the StatsD output option, you have to build a k6 binary using the xk6-output-statsd extension. For more details, refer to StatsD.
Run the CloudWatch agent
We presume that you already have a machine that supports both running k6 and CloudWatch agent, which either runs a flavor of GNU/Linux or Windows. Just go ahead and download the suitable CloudWatch agent version for your operating system.
Create an IAM role to send metrics to CloudWatch via the agent. Then, if you are running on Amazon EC2, just attach the role to your EC2 instance, so that you can send metrics to CloudWatch. Otherwise, if you are running on-premises servers, follow this guide.
Download the CloudWatch Agent package suitable for your operating system. For example, on Debian 10 (Buster), we've used the following link. For other operating systems, please refer to this guide:
Install the package:
Configure the agent to receive data from k6. For this, create a file called "/opt/aws/amazon-cloudwatch-agent/etc/statsd.json" and paste the following JSON config object into it. This configuration means that the agent would listen on port number 8125, which is the default port number for k6 and StatsD. The interval for collecting metrics is 5 seconds and we don't aggregate them, since we need the raw data later in CloudWatch.
Run the following command to start the agent:
You can check the status of the agent using the following command:
Run the k6 test
Once the agent is running, you can run your test with:
Make sure you're using the k6 binary you built with the xk6-output-statsd extension.
You can look at the StatsD output page for configuration options.
Visualize k6 metrics in Amazon CloudWatch
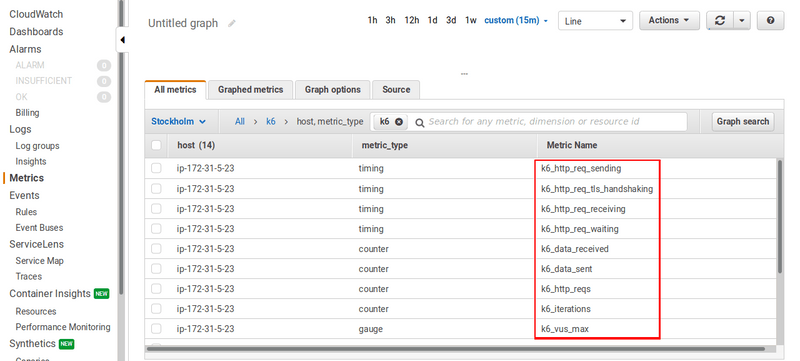
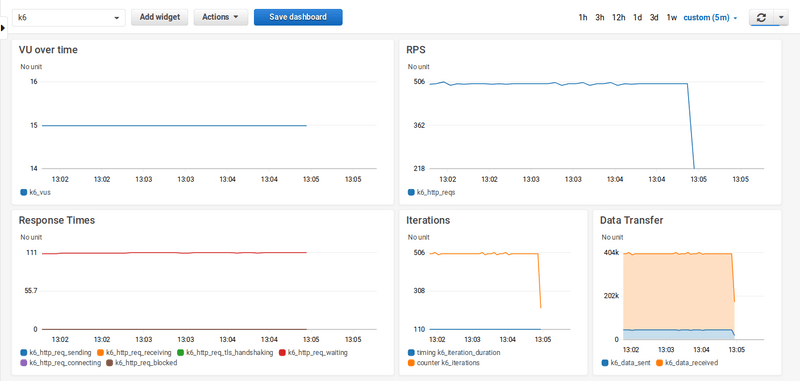
Visualization of the exported metrics to CloudWatch is done by creating a dashboard and selecting desired metrics to be displayed.
Here's an example dashboard we've created to visualize the test results.
The above dashboard is exported as JSON and is available here.

