We shared our detailed analysis of open-source load testing tools in a recent review. In that review, we also promised to share the behind-the-scenes benchmarks. In this article, we'll share those benchmarks so you can see how we arrived at our performance review for each open-source load testing tool.
Remember, too, we narrowed the list for this review to what we consider to be the most popular, open-source load testing tools. This list includes:
- Jmeter
- Gatling
- Locust
- The Grinder
- Apachebench
- Artillery
- Tsung
- Vegeta
- Siege
- Boom
- Wrk
Open Source Load Testing Tool Review Benchmarks
System configurations
Here are the exact details of the systems and configuration we used. We performed the benchmark using two quad-core servers on the same physical LAN, with GE network interfaces.
Source (load generator) system:
- Intel Core2 Q6600 Quad-core CPU @2.40Ghz
- Ubuntu 14.04 LTS (GNU/Linux 3.13.0-93-generic x86_64)
- 4GB RAM
- Gigabit ethernet
Target (sink) system:
- Intel Xeon X3330 Quad-core CPU @2.66Ghz
- Ubuntu 12.04 LTS (GNU/Linux 3.2.0-36-generic x86_64)
- 8GB RAM
- Gigabit ethernet
- Target web server: Nginx 1.1.19
System (OS) parameters affecting performance were not changed from default values on the target side. On the source side we did this:
System tuning on the Source (load generator) host:
We ran the tests with the following configured (we borrowed this list of performance tuning parameters from the Gatling documentation):
- net.core.somaxconn = 40000
- net.core.wmem_default = 8388608
- net.core.rmem_default = 8388608
- net.core.rmem_max = 134217728
- net.core.wmem_max = 134217728
- net.core.netdev_max_backlog = 300000
- net.ipv4.tcp_max_syn_backlog = 40000
- net.ipv4.tcp_sack = 1
- net.ipv4.tcp_window_scaling = 1
- net.ipv4.tcp_fin_timeout = 15
- net.ipv4.tcp_keepalive_intvl = 30
- net.ipv4.tcp_tw_reuse = 1
- net.ipv4.tcp_moderate_rcvbuf = 1
- net.ipv4.tcp_mem = 134217728 134217728 134217728
- net.ipv4.tcp_rmem = 4096 277750 134217728
- net.ipv4.tcp_wmem = 4096 277750 134217728
- net.ipv4.ip_local_port_range=1025 65535
Note, though, that these performance tuning options had no visible effect on the test results. We ran tests with and without the tuning and couldn’t spot any differences in the results. The parameters are mostly trying to increase TCP memory buffers and allow the use of more concurrent connections. We only had max 1,000 connections active in these tests, and did not do a lot of disconnecting and reconnecting, so the tuning wasn't much help. A couple of the options, like TCP window scaling, were already set (they were defaults), so we didn’t really change them.
Tools Tested
Here are the exact versions of each open source load testing tool we benchmarked:
- Siege 3.0.5
- Artillery 1.5.0-15
- Gatling 2.2.2
- Jmeter 3.0
- Tsung 1.6.0
- Grinder 3.11
- Apachebench 2.3
- Locust 0.7.5
- Wrk 4.0.2 (epoll)
- Boom (Hey) snapshot 2016-09-16
A Note on Dockerization (Containers) and Performance
We noted that running the benchmarks inside a Docker container meant that tool performance in terms of Requests Per Second (RPS) rates was reduced by roughly 40% as compared to running the tool natively on the source machine.
All tools seemed equally affected by this, so we did not try to optimize performance for theDockerized tests. This discrepancy explains why a couple of performance numbers quoted will not match what is in the benchmarking results table at the end (those results reflect only Dockerized tests).
For example, running Wrk natively produced 105,000-110,000 RPS, while running it inside a Docker container produced ~60,000 RPS. Apachebench similarly went from ~60,000 RPS to ~35,000 RPS.
A next thing to investigate in a future benchmark would be if/how response times are impacted by Dockerization. It does not seem like Dockerization increases minimum response time (i.e. adds a fixed delay) noticeably, but it may be that response time variation increases.
How we ran the tests
- Exploratory testing with individual tools We began by running the different tools manually, using many different parameters for concurrency/VUs, threads, etc. that the tools offered. There were two objectives we wanted to achieve. We wanted to see if we could completely saturate the target system and in that way find its maximum capacity to serve requests (i.e. how many requests per second (RPS) the target server could respond to). We also wanted to get to know the tools and find out which ones were roughly the best and worst performers, how well they used multiple CPU cores and finally what kind of RPS numbers we could expect from each.
- Comparing the tools
Here we tried to run all tools with parameters as similar as possible. Using the exact same parameters for all tools is, unfortunately, not possible as the tools have different modes of operation, and different options you can set that don’t work the same way across all the tools. We ran the tools with varying concurrency levels and varying network delay between the source and target system, as listed below.
- Zero-latency, very low VU test: 20 VU @ ~0.1ms network RTT
- Low-latency, very low VU test: 20 VU @ ~10ms network RTT
- Medium-latency, low-VU test: 50 VU @ ~50ms network RTT
- Medium-latency, low/medium-VU test: 100 VU @ ~50ms network RTT
- Medium-latency, medium-VU test: 200 VU @ ~50ms network RTT
- Medium-latency, medium/high-VU test: 500 VU @ ~50ms network RTT
- Medium-latency, high-VU test: 1000 VU @ ~50ms network RTT
Note, that the parameters of the initial two tests are likely not very realistic if you want to simulate end user traffic - there are few situations where end users will experience 0.1ms or even 10ms network delay to the backend systems, and using only 20 concurrent connections/VUs is also usually too low to be a realistic high-traffic scenario. But the parameters may be appropriate for load testing something like a micro-services component.
Exploratory Testing
First of all, we ran various tools manually, at different levels of concurrency and with the lowest possible network delay (i.e. ~0.1ms) to see how many requests per second (RPS) we could push through.
At first we loaded a small (~2KB) image file from the target system. We saw that Wrk and Apachebench managed to push through around 50,000 RPS but neither of them were using all the CPU on the load generator side, and the target system was also not CPU-bound. We then realized that 50,000 x 2KB is pretty much what a 1Gbps connection can do - we were saturating the network connection.
As we were more interested in the max RPS number, we didn’t want the network bandwidth to be the limiting factor. We stopped asking for the image file and instead requested a ~100-byte CSS file. Our 1Gbps connection should be able to transfer that file around 1 million times per second, and yes, now Wrk started to deliver around 100,000 RPS.
After some exploratory testing with different levels of concurrency for both Wrk and Apachebench, we saw that Apachebench managed to do 60-70,000 RPS using a concurrency level of 20 (-c 20), while Wrk managed to perform about 105-110,000 RPS using 12 threads (-t 12) and 96 connections (-c 96).
Apachebench seemed bound to one CPU (100% CPU usage = one CPU core) while Wrk was better at utilizing multiple CPUs (200% CPU usage = 2 cores). When Wrk was doing 105-110,000 RPS, the target system was at 400% CPU usage = 4 CPU cores fully saturated.
We assumed 110,000 RPS was the max RPS rate that the target system could serve. This is useful to know when you see another tool e.g. generating 20,000 RPS and not saturating the CPU on the source side - then you know that the tool is not able to fully utilize the CPU cores on the source system, for whatever reason, but the bottleneck is likely there and not on the target side (nor in the network), which we know is able to handle a lot more than 20,000 RPS.
Note that the above numbers were achieved running Wrk, Apachebench etc natively on the source machine. As explained elsewhere, running the load generators inside a Docker container limits their performance, so the final benchmark numbers will be a bit lower than what is mentioned here.
Testing with Similar Parameters
The most important parameter is how much concurrency the tool should simulate. Several factors mean that concurrent execution is vital to achieving the highest request per second (RPS) numbers.
Network (and server) delay means you can’t get an infinite amount of requests per second out of a single TCP connection because of request roundtrip times — at least not with HTTP/1.1.
So, it doesn’t matter if the machines both have enough CPU and network bandwidth between them to do 1 million RPS if the network delay between the servers is 10ms and you only use a single TCP connection + HTTP/1.1. The max RPS you will ever see will be 1/0.01 = 100 RPS.
In the benchmark we decided to perform a couple of tests with a concurrency of 20 and network delay of either 0.1ms or 10ms, to get a rough idea of the max RPS that the various tools could generate.
Then, we also performed a set of tests where we had a higher, fixed network delay of 50ms and instead varied the concurrency level from 50-1000 VU. This second batch of tests were aiming to find out how well the tools handled concurrency.
If we look at RPS rates, concurrency is very important. As stated above, a single TCP connection (concurrency: 1) means that we can do max 100 RPS if network delay is 10 ms.
A concurrency level of 20, however (20 concurrent TCP connections) means that our test should be able to perform 20 times as many RPS as it would when using only a single TCP connection. 20*100 = 2,000 RPS. It will also mean, in many cases, that the tools will be able to utilize more than one CPU core to generate the traffic.
So 20*100 = 2,000 RPS if we have a 10ms network delay. In our case, the actual network delay was about 0.1ms (i.e. 100us, microseconds) between source and target hosts in our lab setup, which means our theoretical max RPS rate per TCP connection would be somewhere around 1/0.0001 = 10,000 RPS. If we use 20 concurrent connections in this case we could support maybe 200,000 RPS in total.
In our first two benchmark tests we used both the actual, 0.1ms, network delay, and 10ms of artificial delay. We call these tests the "Zero-latency, very low VU test” and the "Low-latency, very low VU test” and the aim is primarily to see what the highest RPS rates are, that we can get from the different tools.
The "Low-latency, very low VU test” with 10ms delay is going to generate max 2,000 RPS, which should not be a huge strain on the hardware in the test. It is useful to run a test that does not max out CPU and other resources as such a test can tell us if a load generator provides stable results under normal conditions or if there is a lot of variation.
Or perhaps it consistently adds a certain amount of delay to all measurements. If the network delay is 10ms and tool A reports response times of just over 10ms while another tool B consistently reports response times of 50ms, we know that there is some inefficient code execution happening in tool B that causes it to add a lot of time to the measurements.
The "Zero-latency, very low VU test” with 0.1ms network delay, on the other hand, means the theoretical max RPS over our network and a concurrency level of 20 is 200,000 RPS. This is enough to max out the load generation capabilities of most of the tools (and in some cases max out the target system also), so testing with that network delay is interesting as it shows us what happens when you put some pressure on the load generator tool itself.
Concurrency
Some tools let you configure the number of "concurrent requests”, while others use the VU (virtual user) term, "connections” or "threads”. Here is a quick rundown:
Apachebench
Supports "-t concurrency” which is "Number of multiple requests to perform at a time”
Boom/Hey
Supports "-c concurrent” which is "Number of requests to run concurrently”
Wrk
Supports "-t threads” = "Number of threads to use” and also "-c connections” = "Connections to keep open”. We set both options to the same value, to get wrk to use X threads that each get 1 single connection to use.
Artillery
Supports "-r rate” = "New arrivals per second”. We use it but set it in the JSON config file rather than use the command-line parameter. Our configuration uses a loop that loads the URL a certain number of times per VU, so we set the arrival phase to be 1 second long, and the arrival rate to the concurrency level we want - the VUs will start in 1 second and then for as long as it takes.
Vegeta
Vegeta is tricky. We initially thought we could control concurrency using the -connections parameter, but then we saw that Vegeta generated impossibly high RPS rates for the combination of concurrency level and network delay we had configured. It turned out that Vegeta’s -connections parameter is only a starting value. Vegeta uses more or less connections as it sees fit. The end result is that we cannot control concurrency in Vegeta at all. This means it takes a lot more work to run any useful benchmark for Vegeta, and for that reason we have skipped it in the benchmark. For those interested, our exploratory testing has shown Vegeta to be pretty "average” performance-wise. It appears to be slightly higher-performing than Gatling, but slightly lower-performing than Grinder, Tsung and Jmeter.
Siege
Supports "-c concurrent” = "CONCURRENT users”
Tsung
Similar to Artillery, Tsung lets you define "arrival phases” (but in XML) that are a certain length and during which a certain number of simulated users "arrive”. Just like with Artillery we define one such phase that is 1 second long, where all our users arrive. Then the users proceed to load the target URL a certain number of times until they are done.
Jmeter
Same thing as Tsung: the XML config defines an arrival phase that is 1 second and during which all our users arrive, then they go through a loop a certain number of times, loading the target URL once per iteration, until they are done.
Gatling
The Scala config specifies that Gatling should inject(atOnceUsers(X)) and each of those users execute a loop for the (time) duration of the test, loading the target URL once per loop iteration.
Locust
Supports "-c NUM_CLIENTS” = "Number of concurrent clients”. Also has a "-r HATCH_RATE” which is "The rate per second in which clients are spawned”. We assume the -c option sets an upper limit on how many clients may be active at a time, but it is not 100% clear what is what here.
Grinder
Grinder has a grinder.properties file where you can specify "grinder.processes” and "grinder.threads”. We set "grinder.processes = 1” and "grinder.threads = our concurrency level”
Note here that some tools allow you to separate the number of VU threads and the number of concurrent TCP connections used (e.g. Wrk lets you control this), which is a huge advantage as it lets you configure an optimal number of threads that can use CPU resources as efficiently as possible, and where each thread can control multiple TCP connections.
Most tools only have one setting for concurrency (and Vegeta has none at all) which means they may use too many OS (or whatever-) threads that cause a ton of context switching, lowering performance, or they will use too few TCP connections, which, together with roundtrip times, puts an upper limit on the RPS numbers you can generate.
Duration: 300 seconds
Most tools allow you to set a test duration, but not all. In some cases you set e.g. total number of requests, which means we had to adapt the number to what request rate the tool managed to achieve. The important thing is that we run each tool for at least a decided-upon minimum amount of time. If the tool allows us to configure a time, we set it to 300 seconds. If not, we configure the tool to generate a certain total number of requests that means it will run approximately 300 seconds.
Number of Requests: Varying
Again, this is something that not all tools allow us to control fully, but just like Duration it is not critical that all tools in the test perform the exact same number of requests. Instead we should think of it as a minimum number. If the tool allows us to configure a total number of requests to perform, we set that number to at least 500,000.
A Note on Test Length
A lot of the time, when doing performance testing, running a test for 300 seconds may not be enough to get stable and statistically significant results.
However, when you have a simple, controlled environment where you know pretty well what is going on (and where there is, literally, nothing going on apart from your tests) you can get quite stable results despite running very short tests.
We have repeated these tests multiple times and seen only very, very small variations in the results, so we are confident that the results are valid for our particular lab environment. You’re of course welcome to run your own tests in your environment, and compare the results with those we got.
We provide both a public Github repo with all the source/configuration, and a public Docker image you can run right away. Go to https://github.com/loadimpact/loadgentest for more information.
Open Source Load Testing Tool Review Benchmark Test Results
Note that result precision varies as some tools give more precision than others and we have used the results reported by the tools themselves. In the future, a better and more "fair” way of measuring results would be to sniff network traffic and measure response times from packet traces.
Results: TheZero-latency, very low VU test
The 0.1ms network delay meant requests were fast in this test. Total number of requests that each tool generated during approx 300 seconds was between ~500,000 and ~10 million, depending on the RPS rate of the tool in question.
We could get Average RTT from all tools (except Siege, which wasn’t precise enough to tell us anything at all about response times). Several tools do not report minimum RTT, Apachebench does not report maximum RTT, and reporting of 75th, 90th and 95th percentiles vary a bit.
The metrics that were possible to get out of most tools were Average RTT, Median (50th percentile) RTT and 99th percentile RTT. Plus volume metrics such as requests per second, of course.
Details: Zero-latency, very low VU test
- Network RTT: ~0.1ms
- Duration: ~300 seconds
- Concurrency: 20
- Max theoretical request rate: 200,000 RPS
- Running inside a Docker container (approx. -40% RPS performance)
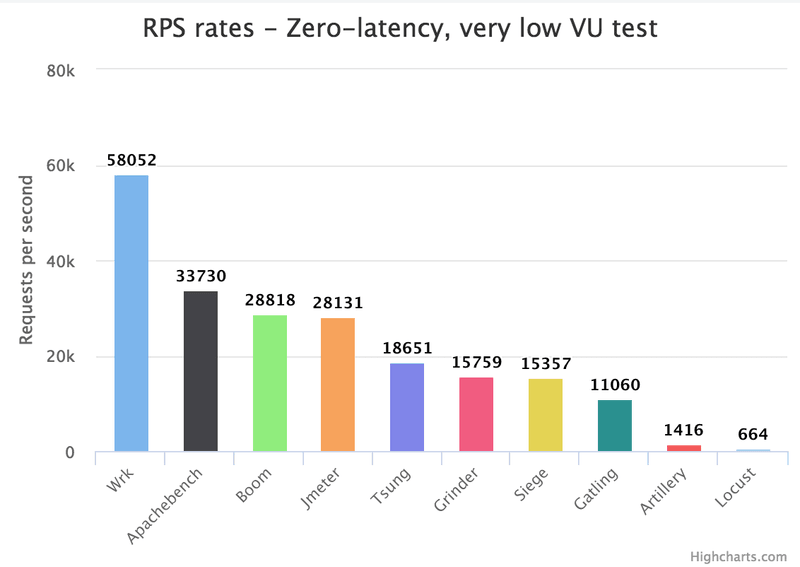
As we can see, Wrk is outstanding when it comes to generating traffic.
We can also see that apart from Wrk we have Apachebench, Boom and Jmeter that perform very well all three. Then Tsung, Grinder, Siege and Gatling perform "OK” while Artillery and Locust are way behind in terms of traffic generation capability.
Let’s see what the RPS rates look like in the test where we use slightly higher network latency, in the Low-latency, very low VU test:
Results: Low-latency, very low VU test
Here we use 10ms of network delay, which meant request roundtrips that were around 100 times slower than in the High-pressure test. Total number of requests that each tool generated during approx 300 seconds was between ~150,000 and ~600,000, depending on the RPS rate of the tool in question.
Details: Low-latency, very low VU test
- Network RTT: ~10ms
- Duration: ~300 seconds
- Concurrency: 20
- Max theoretical request rate: 2,000 RPS
- Running inside a Docker container (approx. -40% RPS performance)
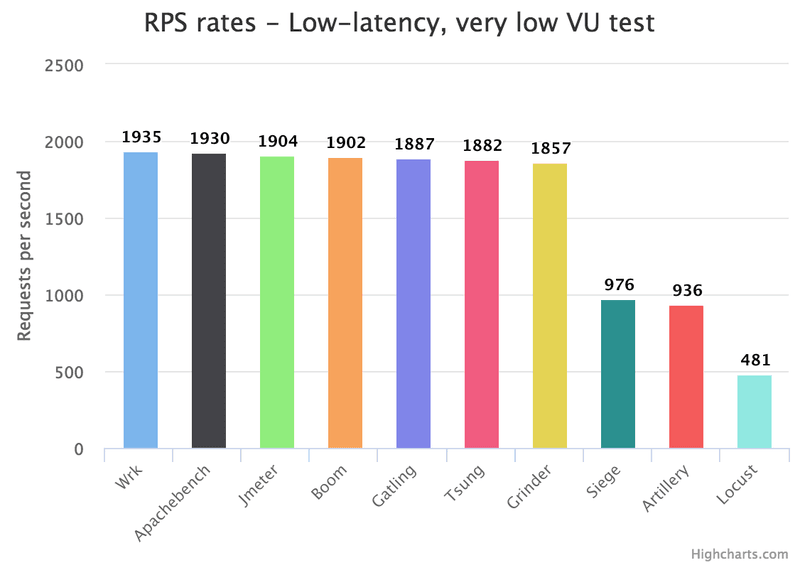
Here, we see that when we cap the max theoretical number of requests per second (via simulated network delay and limited concurrency) to a number below what the best tools can perform, they perform pretty similarly. Wrk and Apachebench again stand out as the fastest of the bunch, but the difference between them and the next five is very, very small.
An interesting change is the fact that the "worst performers” category now includes Siege also. Here is a chart that tells us why Siege seems capped at around 1,000 RPS in this test:
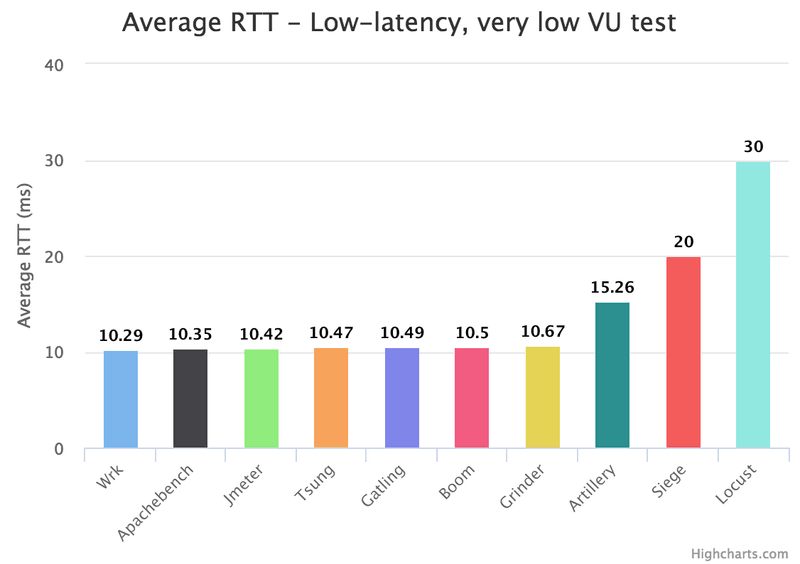
As mentioned earlier, we add 10ms of simulated network delay in this test. The total network delay, to be precise, is around 10.1ms. This means that Wrk, which shows an average transaction time of 10.29ms only adds max 0.2ms to the response time of a transaction (the actual time added is lower, because we haven’t bothered finding out how long the HTTP server takes to process and respond to a request, but it is unlikely to be faster than the kernel responds to an ICMP echo request).
As we can see, most tools add very little to the response time. It’s likely that it’s mostly due to the fact that they are performing way under their max capacity. Artillery and Locust, however, are performing at or near their max capacity and they also add a lot of delay to each request. Siege adds 10ms to the response time, which is the reason we saw in the previous chart that Siege could only generate slightly below 1,000 RPS. Siege, however, is not near its max traffic generation capacity here - stranger things are happening with Siege (more about this later).
Results: Medium-latency tests
Here, we used 50ms of simulated network delay, to create a more realistic RPS rate per TCP connection/VU and instead look at the ability of the various tools to simulate a higher number of VUs/users.
This puts other demands on the target system, as it has to handle a lot more concurrent TCP connections, leading to more memory usage and other interesting effects. We ran four variants of the Medium-latency tests: one with 100 VU, one with 200 VU, then 500 VU and finally 1000 VU.
In these tests, we again aimed for an execution time of around 300 seconds. The total number of requests generated by each tool varied between 150,000 for the slowest tool when simulating 100 VUs, and 5,000,000 for the fastest tool when simulating 1000 VUs. More VUs generally means higher RPS rates, up to a point where factors like e.g. context switching between VU threads means we run into a hard limit for the tool in question.
Details: Medium-latency tests
- Network RTT: ~50 ms
- Duration: ~300 seconds
- Concurrency: 100 / 200 / 500 / 1000 VU
- Max theoretical request rate: 2,000 / 4,000 / 10,000 / 20,000 RPS
- Running inside a Docker container (approx. -40% RPS performance)
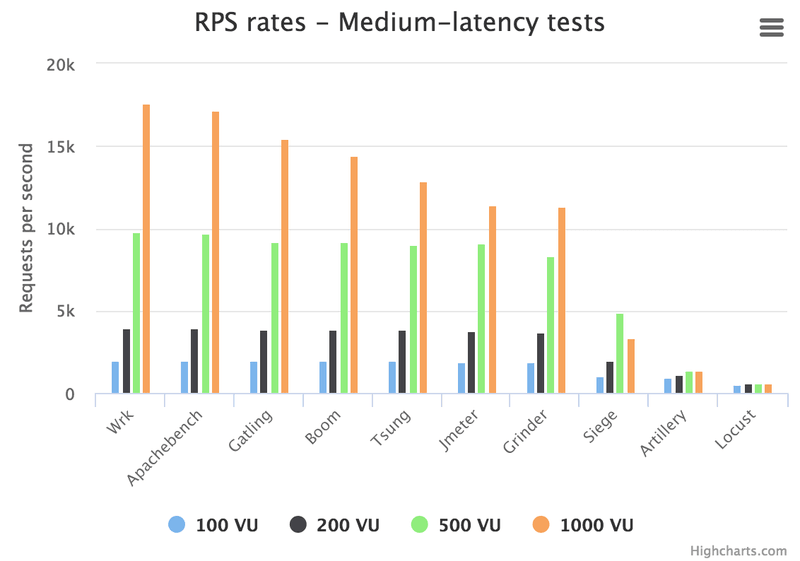
Here we can see that the best tools perform very similarly as long as the number of VUs we simulate stays at 500 or lower. At 1,000 VUs, however, Wrk and Apachebench once again stand out and perform very similarly, then we see a steady decline down to Jmeter and Grinder.
Siege has clearly reached its limit at 500 VU, as its performance at 1,000 VU is worse than at 500. Also, Siege randomly crashes with a core dump at these VU levels, which makes it harder to benchmark it.
We did make some attempts at running the tools manually simulating 2,000 VU also, but gave it up because Siege would crash 100% of the time at that VU level.
No surprises from Artillery and Locust.
Apart from RPS rates, we were also interested in how accurate the various tools were at measuring HTTP response times. Accuracy can vary quite a lot: Tools will introduce an error into the measurements they generate depending on how they handle I/O (event-driven, polling etc), what high-precision time functionality they use, or what kind of calculations they perform. These errors may be big or small, and may also vary depending on how much stress the load generator system is under. For example,a load generator at 100% CPU usage is very likely going to give worse response time measurements than a system at 50% CPU usage. Every tool is unique in how big of a measurement error it introduces, and what parameters affect that error.
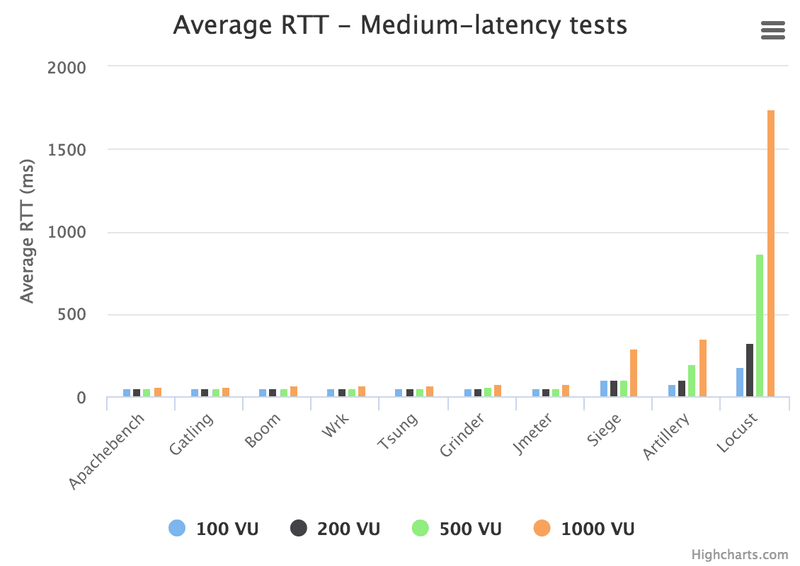
Here is a chart showing the average HTTP response times reported by the different tools, at the four different VU levels tested. Note that we call HTTP response time "RTT” (RoundTrip Time) here, not to be confused with the _network _RTT. Whenever we write just "RTT” we’re referring to the HTTP response time:
As we can see, the worst performers completely skew the scale of the chart so that it is very hard to see any difference between the other tools.
Locust response times were excessive, so we decided to see if that was always the case, or if it was related to the traffic level. We ran a couple of tests with 50ms network RTT and just 5 VUs, to see what response times Locust would measure if we made sure that the traffic generation was as far from taxing as it could possibly get.
The result was a 70-80 RPS rate and Locust reported an average response time of 54 ms, which is OK but not great. It means that at that (incredibly low) level of traffic, Locust just adds 3-4ms of extra delay to the transaction times, on average. At 100 VU, however, the average response time is suddenly 180ms! So at that load level (still pretty low), Locust adds 130ms of extra delay to the measurements.
The conclusion is that Locust response time measurements should be taken with a huge grain of salt. In most cases, the response time Locust reports has nothing at all to do with the response time a real user/client would get at the same traffic level.
Here is a chart with Locust excluded:
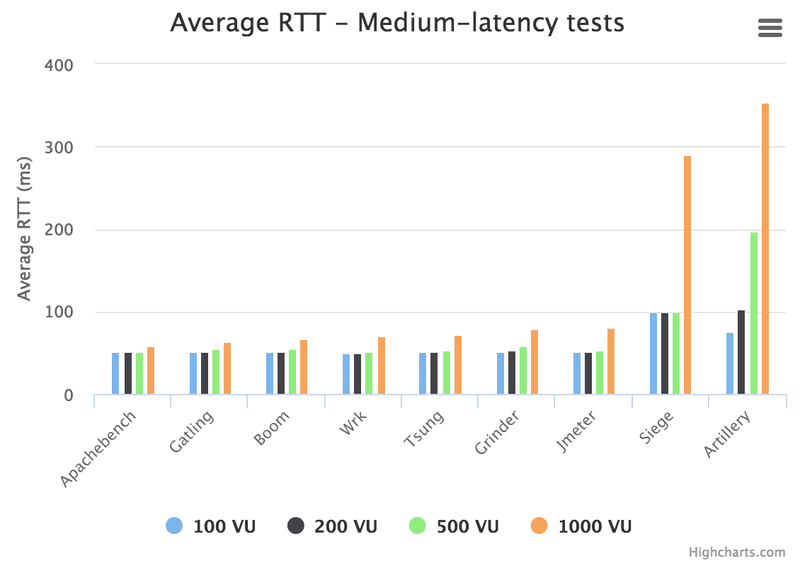
Now we can see a little bit of difference, but not much. Siege and Artillery do not perform well at the higher VU levels, so the scale is still a bit skewed to accommodate them.
Just like Locust, Artillery also seems unable to generate any substantial amount of traffic without greatly increased measurement errors. At 5 VUs it reports 51ms average request RTT. At 100 VUs the request RTT goes up to about 75ms (i.e. 25ms added delay), and at 500 VU it is 200ms (150ms added).
Siege, on the other hand, exhibits a weird behaviour that might be interesting to investigate further, just because it is so strange. With 5 VUs and 50ms of network RTT, Siege reports an average request RTT of 100ms. At 100 VUs, the average request RTT is unchanged at 100ms, and the same goes for 200 VUs and 500 VUs. It is not until we reach 1,000 VUs that the average response time for HTTP requests starts to rise (to 300ms, so clearly we’re running into a wall there).
But why does it report exactly 100ms on all the other traffic levels? 100ms looked like a suspiciously even number, and exactly twice the network RTT we were simulating, too. When we tried changing the network RTT we found that the average request RTT as reported by Siege was always 2x the network RTT!
This is beyond weird. If we had tested only Siege and no other tool, the first thing to suspect would have been that something was wrong with our network delay emulation - that we were adding 50ms in each direction or something, for a total of 100ms, but that is not the case because all other tools report request RTTs of close to 50ms, and Siege itself will report minimum response times that are lower than 50ms. Clearly impossible if the network roundtrip delay is higher than 50ms.
We might dig into this issue more, just to find out what it is, but for the time being it feels pretty safe to conclude that Siege’s measurements cannot be trusted. (and no, the URL we fetched is not redirected…)
So when it comes to measurement accuracy, Artillery and especially Locust are only accurate at load levels that are so low as to not be very practical for load testing, while Siege is a big question mark - it may not be accurate at any load level. These three tools are probably best used for load generation, not for measuring response times.
Let’s remove them all from the chart and see what we get:
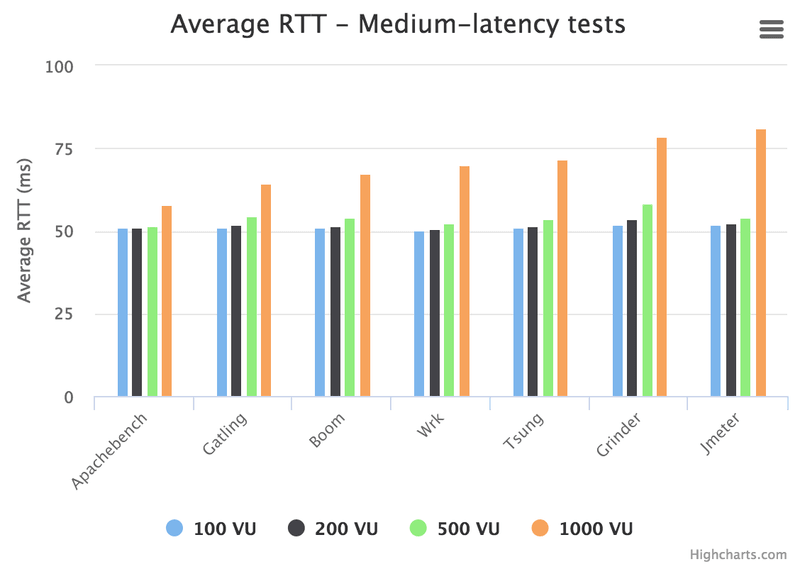
As we can see, there is practically no difference between the remaining tools at the 100-500 VU level, but when you scale up the number of VUs to 1,000 things start to change a bit. (Remember that 50ms is the best possible request RTT because that is the network roundtrip time - this means that a tool that reports 50ms does not add any delay to its measurements).
The chart shows that just like with the RPS rates, Jmeter and Grinder do not seem to like it when we want to simulate a large number of VUs.
Apachebench is the winner here, with practically no measurement error at the 100-500 VU level. Wrk is also doing very well at the 100-500 VU level, but on the 1,000 VU level it is average in the group. To be fair to Wrk, we run it with 1,000 concurrent threads which is probably causing a lot of context switching that reduces performance. The other tools are likely not using so many threads, but are instead distributing 1,000 TCP connections over a much smaller number of threads.
Memory usage: Medium-Latency Tests
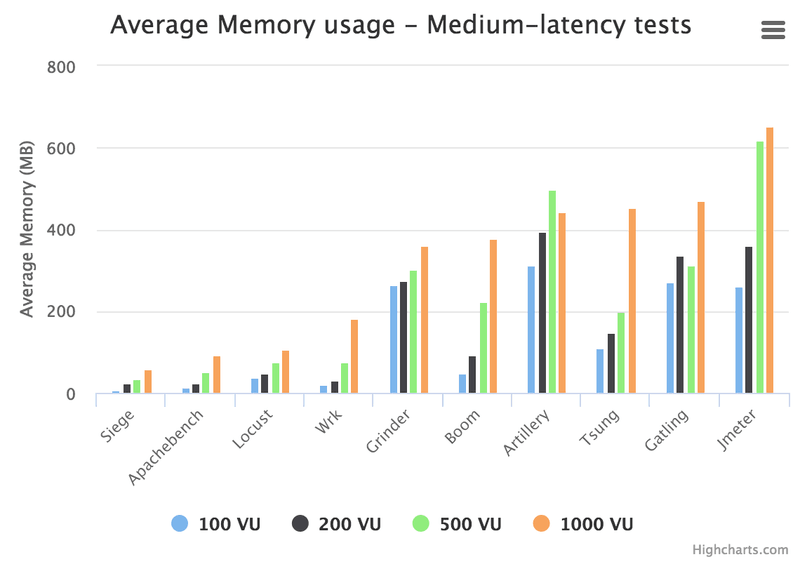
Finally, we want to take a look at memory usage for the various tools. How much memory each tool uses determines how many VUs we will be able to simulate on a given system. If you run out of CPU your measurements will be crap, but the load test will go on. If you run out of memory, your test is toast!
The amount of memory a tool uses depends not only on how "wasteful” it is, but also on how much measurement data the tool collects (and how "wasteful” the internal system is that stores these measurements).
Some tools perform end-of-test calculations on the collected data that means they have to allocate a lot of extra memory at that point - this may cause the application to crash if you run out of memory, perhaps making your whole test run worthless because you got no results.
One way of working around such an issue is to collect your response time measurements with some other application, and just use the load testing tool to generate the artificial traffic that will put stress on the target system.
While peak memory usage would have been interesting thing to measure and report in this benchmark, it can be hard to get an accurate number if a peak is very short-lived. Also, like mentioned above, workarounds that enable people to run a test even if a too-large peak happens at the end of the test, means that what is "acceptable peak memory usage” to one person might not be the same to another.
We have therefore chosen to report average memory usage throughout the test instead, to give some kind of rough idea how much memory you’ll need to simulate a certain number of VUs with each tool.
We have measured memory usage using the "top” utility and logging RSS (Resident Set Size = how much RAM is allocated to the process) with 1-second intervals. Then we have calculated an average throughout the whole test. Here is the chart:
In this category - memory usage - we finally find something Siege and Locust are good at. Memory usage overall is very low with those tools.
This would allow you to simulate quite a large number of VUs on limited hardware, if it hadn’t been for the fact that Locust is abysmally slow and will run out of CPU long before memory becomes an issue, and Siege will just crash.
So I guess that here, again, we see that Wrk and Apachebench have an edge on the rest of the bunch, because neither tool requires a lot of memory to run. They are frugal both when it comes to CPU and memory usage. Jmeter is the application that is the biggest memory hog, on average (remember that this is not peak memory use - we have seen Artillery require a ton of memory briefly just before ending a test run, so it may be the biggest peak user).
Open Source Load Testing Tool Review Benchmark Conclusions
As you've read through the results we found - and the original review article, you may agree that:
- Performance-wise, Wrk and Apachebench are in a class of their ownh3
- Gatling, Jmeter, Grinder, Tsung and Boom all offer good performance, accuracy and reliabilityh3
- Artillery, Locust and Siege have various issues with performance, accuracy and/or reliabilityh3
- None of the tools tested can simulate thousands of VUs on a single machine without significant degradation in measurement accuracy
If you'd like to try the benchmark tests for yourself, we invite you to do so, and share your results with us. For more information, try these links:
- Github load testing tool benchmarking repo: https://github.com/loadimpact/loadgentesth3
- Public Docker image with benchmark setup: docker run -it --cap-add=NET_ADMIN loadimpact/loadgentest
As always, happy testing!

