Earlier this year, we wrote a couple of articles reviewing the functionality, usability (link to review article) and performance (link to benchmark article) of a bunch of open-source load testingtools. Since then, we have uncovered our own open-source load testing tool - k6 - and it would seem it is time for an update to our reviews and benchmarks, so that we both include k6 but also test newer versions of the other tools out there.
So, here are the NEW AND UPDATED open source load testing tool benchmarks!
The tools we tested
| Tool | Version | Link |
| Apachebench | 2.3 | https://httpd.apache.org/docs/2.4/programs/ab.html |
| Artillery | 1.6.0-2 | https://artillery.io/ |
| Gatling | 2.3.0 | http://gatling.io/ |
| Grinder | 3.11 | http://grinder.sourceforge.net/ |
| Hey (previously "Boom") | snapshot 2017-09-19 (Github) | https://github.com/rakyll/hey |
| Jmeter | 3.3 | http://jmeter.apache.org/ |
| k6 | snapshot 2017-09-14 (Github) | https://k6.io/ |
| Locust | 0.7.5 (pip) | https://locust.io/ |
| Siege | 4.0.3rc3 | https://www.joedog.org/siege-home/ |
| Tsung | 1.7.0 | http://tsung.erlang-projects.org/ |
| Wrk | 4.0.2-2-g91655b5 | https://github.com/wg/wrk |
As an extensive review takes a LOT of time, we have skipped the subjective parts this time. k6 is basically our attempt to fix the subjective issues we had with other available tools. If any tool has since fixed issues we wrote about earlier, please contact us and we'll update the old review article to reflect this. This article will try to answer two questions:
- Has there been any change in the relative performance of the tools?
- How does our own tool - k6 - perform in comparison with the other tools?
The setup
The test setup is the same as before: two dedicated, physical, quad-core servers running Linux, located on the same 1000 Mbit/s network switch, which means network delay is very low and as the servers aren't doing anything else, available bandwidth is close to 1000 Mbit/s.
We wanted to run the tools using the same VU levels as in earlier tests, but unfortunately Siege gave us trouble when we tried that. Siege now refuses to simulate more than 255 VU by default, with documentation saying something about operational problems at higher VU levels (which we can attest to), and motivating the limit with the fact that Apache comes preconfigured to serve max 256 clients. You can force Siege to accept higher VU levels by specifying "limit = x" in a config file, but when we tried that, we had issues with Siege freezing at 500 VUs, so in the end we decide to test up to just 250 VU, so that Siege could be included in the benchmark.
Real scripting, or not?
Noteworthy also is that most tools were told to just hit a static URL. These tools include:
- Artillery
- Jmeter
- Apachebench
- Siege
- Gatling
- Tsung
- Hey (previously known as "Boom")
The above tools do not have a built-in scripting language. Well, not a real one at least. Some of them (Artillery, Jmeter, Gatling and Tsung) have DSLs that allow the user to create logic in their test scenarios, but these DSLs are not as powerful and flexible as a "real" language, and are much clumsier to use.
However, the following tools were executing script code during the test:
- Grinder (executing Python/Jython)
- k6 (executing Javascript)
- Locust (executing Python)
- Wrk (executing Lua)
Executing real code which in turn generates HTTP requests is obviously more difficult to do than just generating HTTP requests, so these latter four tools are at a disadvantage in the benchmarks; They offer more flexibility and power to the user/tester, but also consume more system resources as a result. This is important to keep in mind when looking at the test results.
The tests
We executed tests similar to the ones we did in the old benchmark, but we only used 10 ms of simulated network delay, and because of the earlier mentioned issues with Siege, we only tested four different VU levels: 20, 50, 100 and 250 VU. We also ran the tests for only 120 seconds, as opposed to 300 seconds earlier. The number of requests made in each test varied from about 100,000 to 3,000,000 depending on the number of VUs and how fast the tool in question was.
The results
We looked at RPS (Requests Per Second) rates for the different tools, at the different VU levels, and also how much extra delay the tools added to transactions.
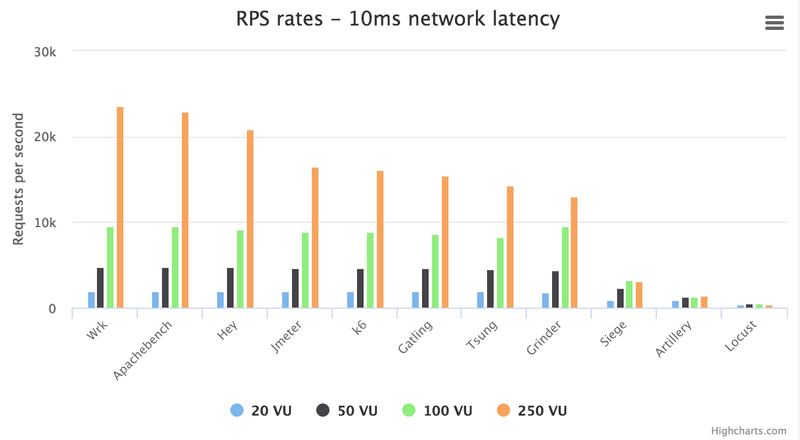
Here are the RPS numbers at the different VU levels tested:
As we can see, when it comes to pushing through as many transactions per second as possible, Wrk rules as usual. Apachebench is a hair's breadth behind Wrk though, and Hey is also quite close. All three did over 20k RPS when simulating 250 VU and the network delay was 10 ms.
After the top three, we have a bunch of decent performers that include Jmeter, k6, Gatling, Tsung and the Grinder. These tools perform maybe 25% worse than the top three, in terms of raw request generation ability. As the difference is not great, I would say that for most people the top eight tools in this list are all very much usable in terms of request generation performance.
The bottom three tools are another story. They can only generate a fraction of the traffic that the top 8 tools can generate. Especially Locust is very limited here; Where most tools in this test manage to produce 15,000 RPS or more, Locust can do less than 500. Artillery is better, but still very poor in terms of request generation, and will only get you close to 1,500 RPS. Siege stops at 3,000 RPS, roughly. These three tools are best used if you only need to generate small amounts of traffic. One point in Locust's favour is that it supports distributed load generation, which allows you to configure load generator slaves and in that way increase the aggregated request generation ability. It means that Locust can be scaled by throwing hardware at the problem. The question is how many slave load generators you can have before the master Locust instance packsup and goes home, as it is likely a bottleneck in the distributed setup.
Response times
So what about response times, then? An ideal tool will be able to accurately measure the response time of the TARGET system (plus any network delay), but in reality all tools add their own processing delay to measurements. Especially when they're trying to simulate many virtual users (or using many concurrent connections) it becomes much harder to produce accurate response time measurements.
In our test we know that the network delay is slightly above 10 ms. Pinging the target system, the ICMP echo responses come back in 10.1 ms, roughly. "Pinging" a system can be thought of as finding out the absolute minimum response time a server application on that system could ever hope to achieve. It includes actual network delay, kernel processing of packets, and such that all programs that communicate over the network have to endure. So our approximation is to say that 10.1 ms is the actual network delay here, as experienced by the application. Ideally, each load testing tool should report response times of 10.1 ms plus whatever processing time the remote web server adds. On the other end is Nginx, a fast server that is serving a single 100-byte CSS file that is going to be very, very cached in memory throughout the test. We can assume processing time is quite small. But instead of bothering to try and find out how many microseconds Nginx takes to process a request, or the kernel takes to process a packet, we have chosen a simpler baseline: the best response time seen throughout all our testing.
I.e. the lowest response time we have ever seen, reported by any of the tools, is our baseline. The time we use to compare all other results. As it happens, Apachebench has reported a minimum response time of 10.12 ms in a couple of tests. This is very close to the 10.1 ms reported by Ping. So that means that a tool that reports e.g. an average response time of 10.22 ms lets us assume that the tool in question adds 0.1 ms on average to its transaction times. Obviously, the lower this number is, the better.
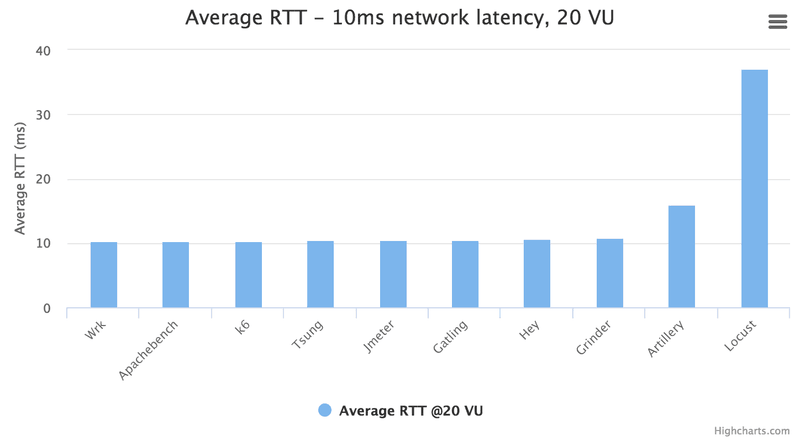
So, here are the average reponse times at the 20 VU level:
Most tools do very well at this low VU level: Wrk is best at 10.27 ms, which means only 0.15 ms is added to the measurements, on average. That error is so small that it is insignificant when you measure a 10 ms response time. The only tools that could be considered "failing" at this level were Artillery and Locust, which on average added 5 ms and 25 ms (+50% and +250% in this case), respectively, to response times. This means that the response time measurements of Artillery and Locust should probably never be trusted - even at low levels of concurrency they simply add too much processing delay.
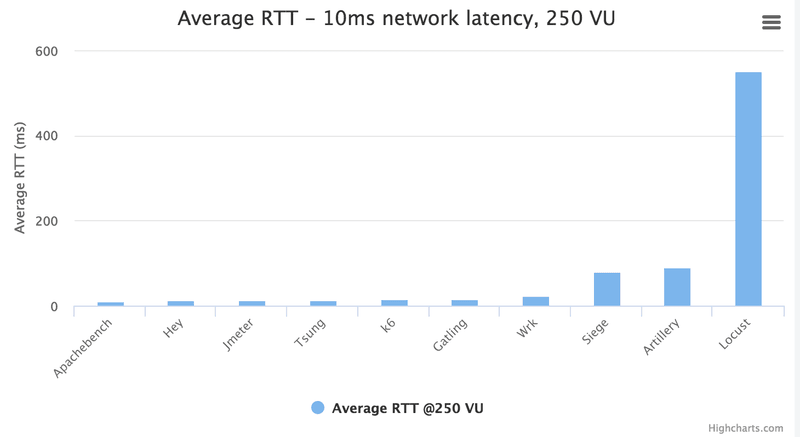
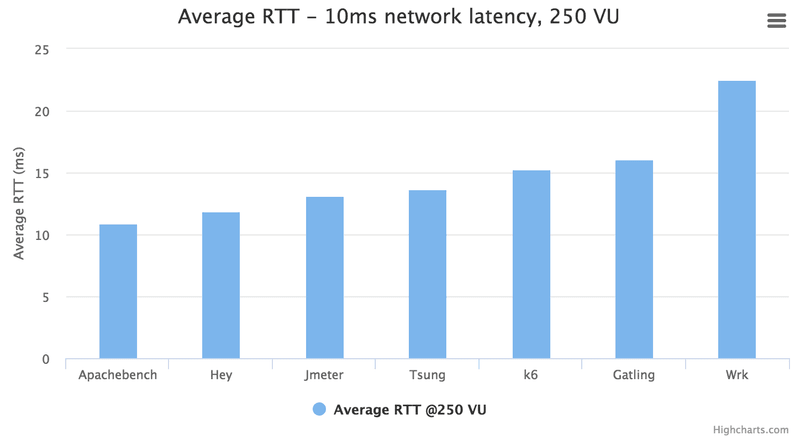
If we look at the 250 VU level, we can see more tools getting in trouble:
Or actually... Mostly we see is that Locust performance is off-the-charts bad. Locust adds so much delay to its measurements that we can't plot it in the same chart as the rest of the tools, because it obscures the results for the others. Locust adds on average 542 ms to a response time that is actually 10 ms. This means, of course, that the response time measurements are completely useless. If you want to simulate any meaningful number of VUs on a single Locust instance, you cannot let Locust measure the response times. Locust can still be used to generate traffic, but you have to measure reponse time using some other tool (although that might not get rid of the issue completely, as Locust performance will likely affect the transaction times regardless of who is doing the measuring).
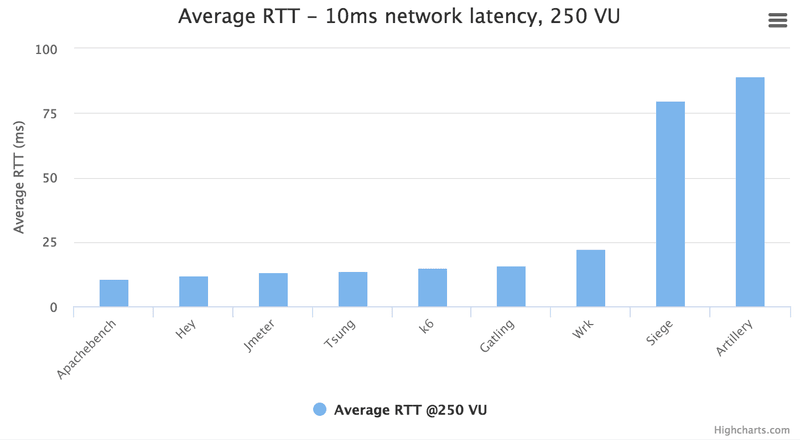
If we remove Locust from the chart, it looks like this:
We can now see that the best is Apachebench, which reports an average reponse time of 10.91 ms, which should be considered the baseline for this VU level (250 VU). We can't say for sure that Apachebench adds on average 0.8 ms to each transaction, because we don't know if these 0.8 ms is delay added on the client side or the server side. It may be that the target system average response time has increased from where it was when we tested at the 20 VU level. But we can say that 10.91 ms is the time to beat for all the tools, and we can compare the rest of the tools to the best performer, just like we did at the 20 VU level.
But Siege and Artillery are still clouding the results a bit, as they don't perform very well; Siege reports an 80 ms average response time, which we know is almost 8 times the actual response time, and Artillery is even worse with ~90 ms average response time. Let's remove these two laggards also. This is what we get then:
So, here again we see that a bunch of tools offer similar performance: Apachebench, Hey, Jmeter, Tsung, k6 and Gatling all report average reponse times within a ~5 ms range.
It may be surprising that Wrk comes last here, as it is usually the top performer in all benchmarks, and we first thought it was due to the fact that we force Wrk to use 250 operating system threads as a way of simulating 250 VU, which we thought may cause unnecessary context switching. No other tool allows you to specify the number of OS threads to use. For some (k6, Hey, Jmeter, Gatling, probably Tsung), it is decided automatically by the language runtime, and for others (e.g. Apachebench) the application code decides, but it means that for most, there is smart code somewhere that can optimize the number of OS threads depending on the concurrency level requested. But when testing this theory, running Wrk with 250 concurrent connections and 10 OS threads, we still saw the average response time reach 20+ ms. It seems Wrk experiences a fair amount of very high response times that skews the average - the 90th percentile stays consistently low at 10.3-10.4 ms, but the 99th percentile always ends up at around 600 ms at the 250 VU level (whether we use 10 threads or 250).
- If you want to look at detailed results from the testing, here is a spreadsheet: https://docs.google.com/spreadsheets/d/13ZCxDxy06LlhDD0vuys9R04ppGv787c7DkZT1XO5-Gc/edit?usp=sharing
Conclusions
- The tools perform pretty similarly to last time we benchmarked them. No major surprises or changes.
- k6 seems to do pretty well in terms of performance. It is actually the best performer of the tools that execute a real scripting language.
Tips for choosing a tool
And for those who did not read the last benchmark test article or the tool review article, I can add some general thoughts on how I would reason when choosing between the different tools:
- If the only requirement is to achieve the absolute max in terms of RPS numbers, I'd choose Wrk or Apachebench
- If I have very simple needs - only want to hit a single, static URL and don't need detailed statistics - I'd choose one of the simpler tools: Apachebench, Hey, Wrk
- If I want a more versatile tool, with both decent performance and more functionality/flexibility, I'd choose one of: Gatling, Grinder, Jmeter, k6 or Tsung. They all perform very well and provide a lot of configuration- and results output options.
- If I want to write my test cases using real code, I'd choose Grinder or k6. If I don't care about tool performance I may also be able to use Locust.
Repeat the tests yourself
It is actually very simple! We just released an updated load testing tool benchmark test suite that makes benchmarking the tools (or just trying them out) ridiculously simple:
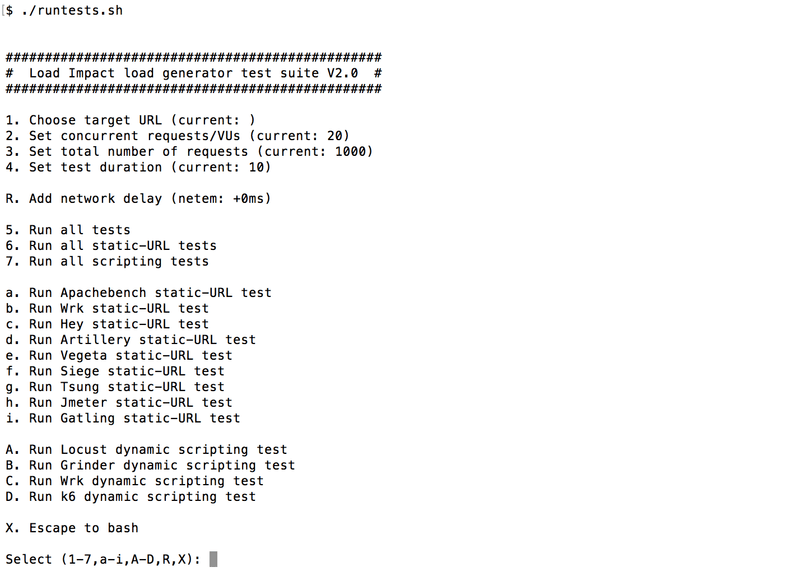
That's it. The shell script runtests.sh will show you a menu that looks like this:
You enter a target URL using option "1", then you can stress that URL using different tools and settings, simply by pressing a button. You have to have docker installed, because the various load testing tools are run as docker images (based on Alpine Linux), fetched from Docker hub. You also have to have some kind of target system you can make life miserable for, of course - don't load test any public site out there that isn't yours! (Note that runtests.sh is able to use Linux netem to add simulated network delay - option "R" - but this only works if you're root, so start the script as root if you want to use that feature)
Contribute!
Would be great if people helped adding more tool support to the https://github.com/loadimpact/loadgentest repo as there are several load testing tools out there that we haven't been testing.
