REST APIs make up about 83% of all APIs currently in use. Performance testing of APIs is becoming more and more critical to ensure overall system performance. Let's take a look at how we can use the k6 open source load testing tool to performance test REST API endpoints.
But first, let's consider some possible reasons why we'd want to do that:
- To gauge the limits and capabilities of our API, and by extension, our infrastructure at large.
- To enable Continuous Integration and automation processes that will, in turn, drive the baseline quality of our API.
- To move towards Continuous Delivery and Canary Deployment processes.
Assumptions and first steps
For this guide, our target system running the API runs locally on a very modest and restricted environment. So, the various parameters and result values are going to be significantly lower than those someone would anticipate in a real, production environment. Nevertheless, it will do just fine for the purposes of this guide since the assessment steps should remain the same no matter the infrastructure at hand.
A RESTful API service typically has numerous endpoints. No assumptions should be made about the performance characteristics of one endpoint, by testing another. This simple fact leads to the realization that every endpoint should be tested with different assumptions, metrics and thresholds. Starting with individual endpoints is a smart way to begin your API performance testing.
For the purposes of running small load tests on our REST API endpoints, we will use the command line interface (CLI) local execution mode of k6. For information on how to install k6 locally, read this article.
As you start testing production-like environments, you will likely need to make use of the automated load test results analysis provided by k6 Cloud Performance Insights.
After testing various endpoints in isolation, you may start to move towards tests that emulate user behavior or that request the endpoints in a logical order. Larger performance tests may also require k6 Cloud Cloud Execution on the k6 Cloud infrastructure.
Our stack consists mainly of Django and Django Rest Framework, which sit on top of a PostgreSQL 9.6 database. There's no caching involved so that our results are not skewed.
Our system requires Token-based authentication, so we have already equipped ourselves with a valid token.
Load Testing Our API
With the above in mind, we'll start load testing the v3/users endpoint of our API. This endpoint returns a JSON list of representations of an entity we call User. As a first step, we are going to perform some ad hoc load tests, to get a "feel" for this endpoint to determine some realistic baseline performance thresholds.
Performing GET requests
We first need to create a file named script.js and provide the following content:
The above script checks that every response to that API endpoint returns a status code of 200. Additionally, we record any failed requests so that we will get the percentage of successful operations in the final output.
Usually, we should start with somewhat modest loading (e.g. 2-5 Virtual Users), to get a grasp on the system's baseline performance and work upwards from that. But suppose we are new at this and we also feel a bit optimistic, so we reckon we should start a load test of the above script with 30 Virtual Users (VUs) for a duration of 30 seconds.
We execute the k6 test with the aforementioned parameters:
The below partial output of our load test indicates there is an error.
Figure 1: First load test run results show only 14% of requests get a response
We see that only 14% of our requests were successful. This is abysmally low!
OK, so what happened? Well, if we were to show the full output of the load test, we'd notice that we get a lot of warnings of the type:
We immediately understand that most requests timed-out. This happened because the default timeout value is set to 60 seconds and the responses were exceeding this limit. We could increase the timeout by providing our own Params.timeout, in our http.get call.
But, we don't want to do that just yet. Suppose that we believe that 60 seconds is plenty of time for a complete response to the GET request. We'd like to figure out under what conditions our API can return proper and error-free responses for this endpoint.
But, first we need to understand something about our load test script. The way we wrote it, every virtual user (VU) performs the GET requests, in a continuous loop, as fast as it can. This creates an unbearable burden on our system, so we need to modify the test. Consequently, we decide to add a sleep (aka think time) statement to our code. The necessary code changes are the following:
This produces:
Figure 2: Load test results show 62% of requests pass
OK, things improved a lot, but still, 38% of our requests timed-out. We proceed by increasing the sleep value for each VU to 1 second:
And we rerun the test, while keeping the same number of VUs:
This produces a more desirable outcome for our system:
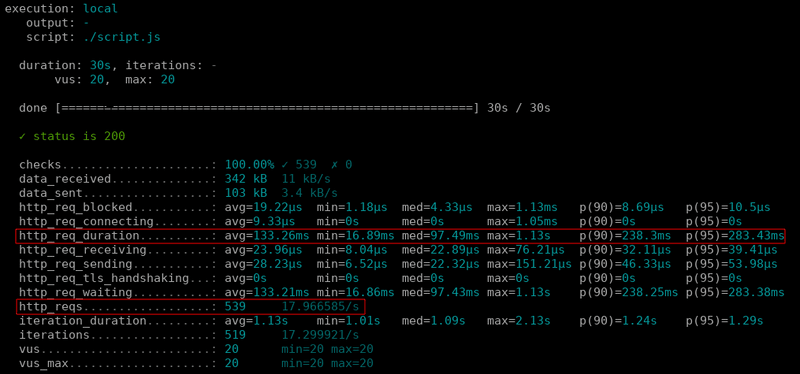
Figure 3: Load test results show all GET requests finish with 200 status; 95% of requests served in under 283.43ms
Some things we notice from the above output:
- All requests finished in a timely manner, with the correct status code
- 95% of our users got served a response in under 283.43ms
- In the 30 second test duration we served 539 responses, at a rate of ~18 requests per second (RPS)
Now we have a better idea of the capabilities of this endpoint when responding to GET requests, in our particular environment.
Performing POST requests
Our system has another endpoint, v3/organizations, that allows POST requests we use when we want to create a new Organization entity. We want to run performance tests on this endpoint.
A few things to note here:
- We changed the http.get to http.post. There's a whole range of supported HTTP methods you can see here.
- We now expect a 201 status code, something quite common for endpoints that create resources.
- We introduced 2 magic variables, VU and ITER. We use them to generate unique dynamic data for our post data. Read more about them here.
Armed with experience from our previous test runs, we decide to keep the same VU and sleep time values when running the script:
And this produces the following results:
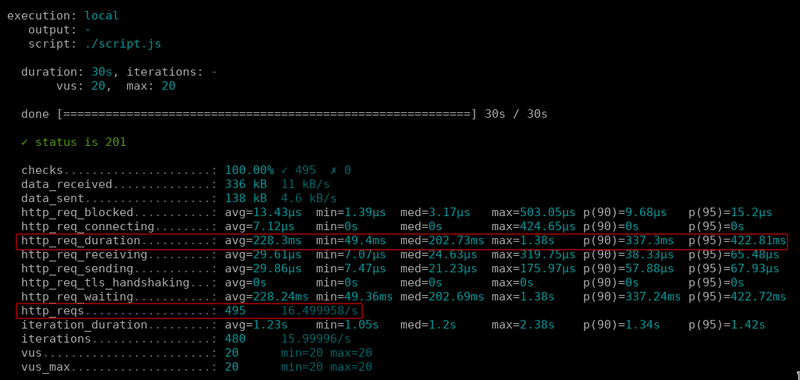
Figure 4: Load test results for POST requests to the _v3/organizations endpoint_
We notice from the results above that we managed to serve all POST requests successfully. We also notice there was an increase in the duration of our responses and a decrease in the total number of requests we could handle during a 30 second test duration. This is to be expected though, as writing to a database will always be a slower operation than reading from it.
Putting it all together
Now we can create a script that tests both endpoints, while at the same time providing some individual, baseline performance thresholds for them.
In the above example we notice the following:
- We created separate rates and trends for each endpoint.
- We defined custom thresholds via the options variable. We increased our thresholds because we don't want to be too close to our system's limit- the 95th percentile is less than 500ms for GET requests (Users) and 800ms for POST requests (Organizations).
- We introduce the batch() call, that allows us to perform multiple types of requests in parallel.
Because we are introducing more concurrent load on our system, we also decide to drop the number of VUs down to 15:
And here are the results:
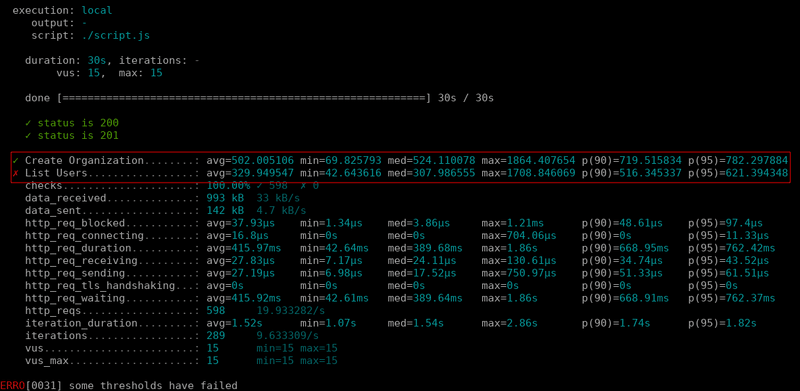
Figure 5: Load test results for the test of both API endpoints
We observe that all requests were successfully processed. Additionally, we now have 2 extra rates ("Create Organization" and "List Users") with visual indications about their threshold status. More specifically, Create Organization succeeded but, List Users failed, because the 500ms p(95) threshold was exceeded.
The next logical step would be to take action on that failed threshold. Should we increase the threshold value, or should we try to make our API code more efficient? In any case, we now at least have all the necessary tools and knowledge to integrate load testing as part of our workflow. You could continue your journey by reading some of our CI/CD integrations guides.


