When it comes to building and deploying applications, one increasingly popular approach these days is to use microservices in Kubernetes. It provides an easy way to collaborate across organizational boundaries and is a great way to scale.
However, it comes with many operational challenges. One big issue is that it’s difficult to test the microservices in real-life scenarios before letting production traffic reach them.
But there are ways to get around it. In this post, I’m going to take a look at the tools we use here at Grafana Labs to test the integration between our various services at deployment time, for every changeset: Grafana k6 to test our services and Flagger to handle the interactions with Kubernetes.
Pieces of the puzzle
Grafana k6 is primarily a performance testing tool — check out this post to learn more about how we use it for that purpose — and it is versatile. Not only can you write performance-focused load tests, but it is also possible to write structured test cases, smoke testing, or any kind of workflow that hits a service’s HTTP API. Responses can be verified against various assertions, and the attributes of responses can be used to craft further requests. One great thing about k6 is that it’s Javascript-based, which allows for more flexibility.
Here’s a simple example where an API is called and the request duration is checked:
Flagger, from Weaveworks, is used to analyze Kubernetes deployments. It enables canary or blue/green releases, A/B testing, and traffic mirroring (shadowing). It supports querying a variety of metrics sources to determine the canary’s health before, during, and after traffic is moved from the previous version.
On its own, Flagger depends on external traffic and metrics exposed by the service to determine the health of the new deployment. To simulate external traffic, a load tester is also provided to generate traffic before fully exposing the canary to users.
Flagger is configured through a Canary Kubernetes resource. Here’s a simple example of what a configured Canary resource looks like:
After this Canary resource is created, the my-app deployment configuration is copied to a my-app-primary deployment, and the my-app deployment is scaled down. On new versions, my-app is scaled up, tested, and then promoted to -primary.
Combining Grafana k6 and Flagger forces
At Grafana Labs, our goal is to ensure the correctness of every deployment made to production. We also want to track various properties of deployments, such as average request duration of versions over time.
Neither Grafana k6 nor Flagger does all of that on its own. k6 does not provide any control over deployments. It has to be pointed at an existing service that is reachable from the runner. Flagger does not provide a testing solution that is suitable for all HTTP services. Its own load tester cannot reject a canary based on responses — it’s a fire-and-forget client. This means that all services that are tested must be suitably instrumented with metrics, and complex test cases cannot be implemented.
But when these two great tools are combined, they provide the complete solution.
What is missing to complete the integration between Flagger and k6 is a simple Flagger webhook handler that calls k6 on behalf of Flagger. When deployed alongside Flagger, the “flagger-k6-webhook” provides a pre-rollout check (before traffic is sent to the canary) that can run any k6 script, notify users via Slack, and either fail or succeed the check based on thresholds defined in the k6 script.
Each canary can be configured individually using a Flagger webhook. The configuration passes a full k6 script, which means any script used for this purpose can also be run locally for development purposes or for use in other processes.
Here’s an example combining the two previous examples (from k6 and Flagger):
Currently, logs and results produced by test runs are most easily accessed through Slack. Flagger and the “flagger-k6-webhook” both support Slack natively, so when we enable Slack integration for both, messages appear in the order you’d expect:
With all the pieces in place, manual testing processes can now be code-ified and automated. This is also a great way to document critical API endpoints, their expected behavior, and how they are tested. This is invaluable information for both new developers learning the service and established developers proposing changes.
Observing results in Grafana Cloud k6
This integration can be leveled up by using Grafana Cloud k6, where you can send the results of tests from all of your versions. It’s important to note that tests will still run in the load tester process, not with cloud’s runners. (See the webhook’s docs for more information about how to set this up.)
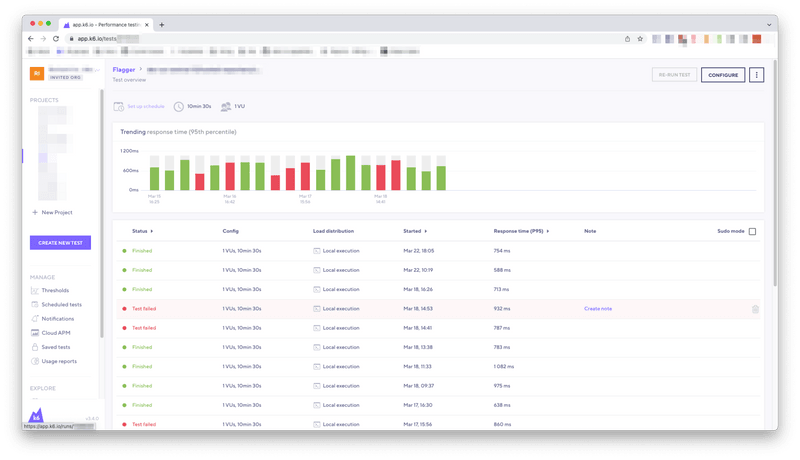
Here’s a screenshot from one of our services, where you can see an overview of the results from many deployments over time:
To look at detailed views of every different request result, all you would have to do is click on each of the runs.
What’s next
The “Flagger-k6-webhook” integration is already in a very capable state, but we will continue fixing and improving it as requirements arise. However, most of the heavy lifting is being done by Grafana k6 and Flagger — which are both extremely active projects — rather than the integration itself.
Here at Grafana Labs, we have had very successful pilot projects to expand the use of this service internally, and our teams are finding lots of potential use cases. For example, we’ll be exploring how to test a service’s integration with Slack or email after it has been deployed. Hopefully, this will lead to new features and usability improvements to the integration that the community can also benefit from.
Come find us in the repository’s discussion section if you have any questions or feedback!
