Note: This blog post has graphics from our older performance testing solution, Load Impact, which is no longer available and was replaced by k6. You can check out the documentation and website for more information about k6.
Does Real User Monitoring eliminate the need for synthetic performance testing and monitoring? Not for environments where scalability and resilience to load are just as important as end-user experience.
The two approaches come at slightly different problems and generate different types of data but also have some overlap which may cause confusion with IT staff when making purchasing decisions. Hopefully, in this post we can help better define the two approaches.Real User Monitoring (RUM) is a set of technologies that allows IT staff to passively monitor user experience, performance problems and a wide variety of user interactions with the applications being monitored.
RUM can take several different forms, and it's worthwhile to take a moment and understand the different methods to implement passive monitoring and what the advantages are. After that we will contrast RUM with synthetic performance testing and when to use one or the other or both.
Most traditionally, RUM has been passively implemented by incorporating snippets of code in the application itself. A wide variety of metrics can be collected but most commonly you want to know load times, rendering experience, etc.
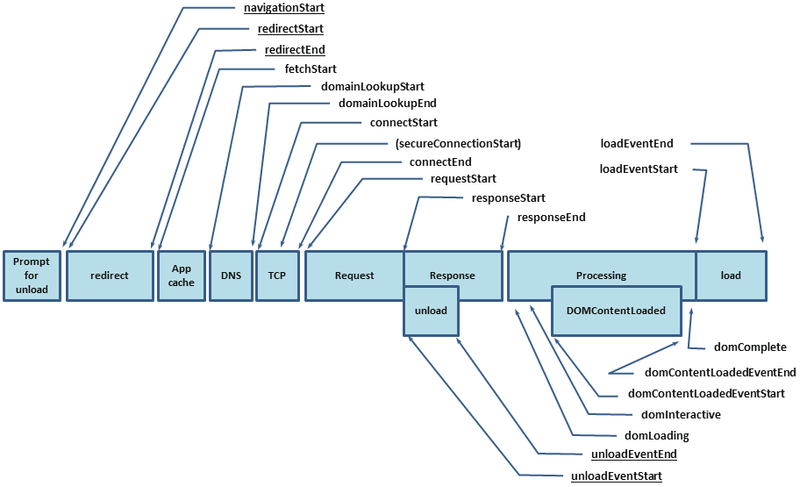
Modern browsers support what is called the "Navigation Timing API," which allows code imbedded in the application to invoke this browser API. The API allows for a stopwatch to be applied (for lack of a more technical term) on a variety of operations that may be of interest.
This API allows for timing of a wide variety of browser to server interactions
For example, if you want to time the connection to the server, then the following two attributes can be collected:
connectStart attribute
This attribute must return the time immediately before the user agent starts establishing the connection to the server to retrieve the document.
connectEnd attribute
This attribute must return the time immediately after the user agent finishes establishing the connection to the server to retrieve the current document.
This would be helpful in diagnosing TCP connection issues where you suspect last-mile loss or latency could be an issue, not server bandwidth or other issues.
Another example would be timing DNS lookups, possibly pointing to third-party congestion or problems:
domainLookupStart attribute
This attribute must return the time immediately before the user agent starts the domain name lookup for the current document.
domainLookupEnd attribute
This attribute must return the time immediately after the user agent finishes the domain name lookup for the current document
A final example would be to test how long SSL negotiation is taking, to help diagnose HTTPS session handshake latency, possibly pointing to the need for hardware SSL acceleration or other application delivery optimizations around SSL:
secureConnectionStart attribute
This attribute is optional. User agents that don't have this attribute available must set it as undefined. When this attribute is available, if the scheme of the resource is HTTPS, the attribute must return the time immediately before the user agent starts the handshake process to secure the current connection. If the secureConnectionStart attribute is available but HTTPS is not used, this attribute must return zero.
It's worth mentioning that there are a number of commercial products that utilize this API or custom written code to accomplish similar functions in legacy browsers, depending on the level of detail and customization you might need.
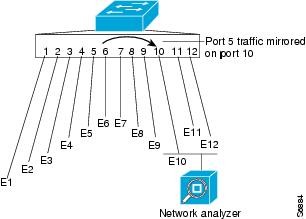
Another way to do RUM is by passively looking at traffic to and from the application. The appropriate way to do this is to take either a SPAN (aka Port Mirroring) session from the appropriate switching infrastructure or a copy of traffic from a network visibility layer. This is an area I have very recent experience in having worked for a market leader in network visibility.
A very simple diagram of port mirroring where traffic to and from a webserver (port E6) can be copied to a monitor port and sent to a RUM solution
In highly complex, dense, virtualized environments, a SPAN session (assuming the network team is even willing) will often contain a vast array of irrelevant traffic to this initiative, which can make filtering difficult.
If you are fortunate enough to have a network visibility layer or switch in place, then relevant traffic from multiple points in the network can be aggregated and filtered before being sent to the RUM solution.
The benefit here is the RUM product is only getting packets relevant to the applications being monitored. By not sending a "fire hose" of packets (often at 10gb/sec or higher) the RUM solution or any passive monitoring tool will operate more efficiently.
The way these types of RUM solutions work is more opaque and vendor specific, and most on-premise APM vendors have a RUM or user experience monitoring solution that will leverage packet data. These solutions are clearly at the high end of the cost spectrum and are not typically found in small-to-medium shops. Packet data from the monitor port will be written to disk (or cached) and then sessionized to build a picture of a user's session and experience.
Since you have the entire conversation and often times the packet + payload, much can be inferred from this data regarding performance of the application. Oftentimes the RUM functionality is a subset of a larger solution that may include packet capture, APM, security, etc. Savvy IT buyers may be able to leverage discounting when procuring a product suite like this from a strategic vendor.
A RUM solution of this type, as I mentioned above, is an enterprise solution and must be on-premise or co-located with the applications being monitored. This obviously eliminates most shared hosting environments, some CDN deployments and anywhere you don't control the rack and network. There also needs to be cooperation between the application & network teams, which is a challenge we have discussed here before.
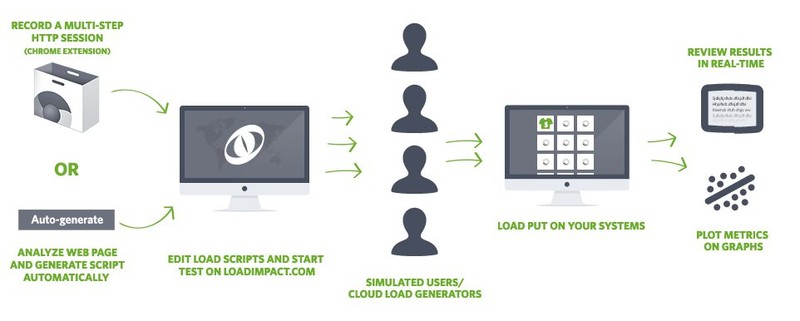
Now on to synthetic user testing, which is what we use at Load Impact to simulate traffic load on applications. As it sounds, synthetic performance testing simulates a real browser's interaction with the application and gathers metrics from both the client side and server side (assuming you use our server metrics agent). Browser simulation can mimic various browser types, connection types and other end user characteristics.
Here is the flow of our synthetic performance testing from start to finish
Synthetic testing is valuable for performance testing and performance measurements for the following reasons:
- Synthetic testing can be integrated into a DevOps-style of continuous development & testing program. Tests can be generated and run against development servers with early stage applications and still gather very relevant metrics while an application is in early stages of development.
- Synthetic testing can accomplish multi-geo testing. In a single test we can simulate up to 10 regions of the world and even more with some quick customization. This is a critical component of testing if your application is global
- Synthetic testing can be comprised of very simple navigation of an application or highly complex, fully scriptable behavior. We will be talking more about scripting next week — so stay tuned!_
- Most importantly, synthetic testing allows for truly massive user loads to be generated in a way that best represents expected utilization. There is no way to really know how well an application (and infrastructure) will hold up to millions of users and transactions without robust performance testing.
Application owners should consider what is most important before buying and deploying new tools. There is a very good case to be made that both synthetic and RUM testing & monitoring should go hand in hand.
Understanding that a single user is having a good experience is very important, and proving that an application can sustain 10,000 transactions per minute is also important for many business owners.
But knowing that user experience is excellent while 10,000 other sessions are active is priceless. And that's the beauty of performance testing!


