📖What you will learn
- The basics of performance testing methodology
- How to plan and execute the three phases of a performance testing
- How to do baseline testing and how to scale from there
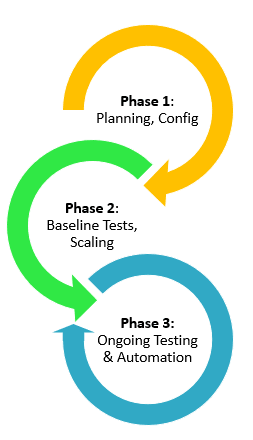
Successful performance testing of websites, web apps and APIs requires planning. You may want to jump in, pick a load testing tool and start testing, but let’s take some time to establish our methodology first. A software performance testing methodology requires a number of steps. Let’s break them down into 3 phases:
- Phase 1 - Planning, Test Configuration, and Validation
- Phase 2 - Baseline Testing, Scaling Your Tests, and Complex Cases
- Phase 3 - Ongoing Performance Testing and Automation
Figure 1: 3 Phases of Performance Testing Methodology
It’s important to keep in mind that performance testing should be part of a continuous testing process that extends throughout the full software development lifecycle. This means that developers should start performance testing early in the development cycle, along side functional unit tests. They can hand off test scripts to the QA team for larger tests later in the cycle. In phase 3, as we’ll discuss below, you’ll automate your load tests as part of your Continuous Integration (CI) pipeline. All of this is aligned with incorporating performance testing into your DevOps methodology. (See this previous article on Dzone).
Phase 1- Planning, Test Configuration, and Validation
Planning
What are the most important parts of the system you’re testing? How do the critical components impact performance, and ultimately, the user experience? Perhaps a handful of API endpoints are most critical to the performance of your system. For example, the app login process may hit these endpoints. Focus on these APIs and endpoints in your load testing plan.
Once you’ve identified the key components, what are the expected outcomes? Are there historical performance testing results or events you can use to specify the target outcomes? Continuing with the login example, perhaps there was a previous release that experienced heavy traffic of users trying out new features and the response time of your login process was degraded. You can use that to establish the expected response time of your load tests for this component of your site or app in the next release.
Figure 2: Test Results Showing Response Time (Yellow Line)
There could be other business requirements that you should you consider. Has the business implemented any service level agreements (SLAs) or other requirements that relate to performance such as certain response times, availability, etc.?
Another important part of the planning process involves the nature of the target environment. Is it a production environment or a staging / test area? A test environment that matches production is best, but is not always available. Testing your production environment requires additional planning to avoid disruption to your business.
Test Configuration
Next up is performance test configuration. Here are some things to consider when you start to write or record (see browser recording below) your first performance test script:
- Closely related to the above, what are the most common actions users will take that involve the critical components you want to test? Logins tend to be one important part of an application. If you’re testing user journeys, consider the logical order users of your application typically follow. Don’t get caught up with trying to test everything in the first pass; focus on the most important parts first. So, skip (for now) that feature that only a handful of users use on a regular basis.
- Determine how much load you should put on your target system. If you’re testing individual components, such as API endpoints, think in terms of Requests per Second (RPS). If testing user journeys through a website or web app, such as users visiting a number of different pages or taking multiple actions, think in terms of concurrent users- we’ll simulate those concurrent users with virtual users (VUs) during the performance tests.
- Next consider the types of performance tests you need to run. Different tests will tell you different things. Here’s a test sequence that will work for most organizations when establishing a testing process: baseline test, stress test, load test, spike test (if applicable) (See this previous article to learn more about the different types of performance tests).
- Depending on your test scenario, you may need to provide some data. Using the login example again, testing the same user logging in over and over again will usually only test how well your system can cache responses. In this case, you should import a parameterized data file with usernames and passwords to properly test the login process.
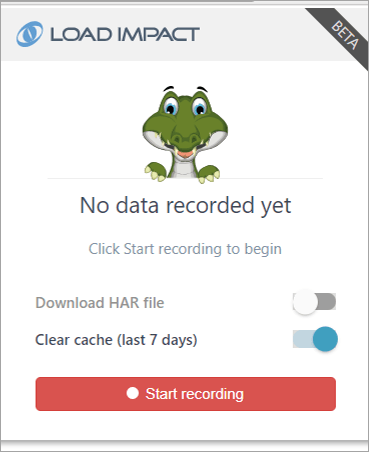
Now you’re ready to start writing your test scripts by hand or by using a browser recorder (Chrome extension) or a HAR file converter to create a test script. The browser recorder approach allows you to easily create realist user scenarios.
Figure 3: Using the Load Impact k6 Test Script Recorder for Browser Recording
It’s best to start small and then expand your test coverage. Treat writing your test scripts as you would code you are writing for your application by breaking it down into smaller, more manageable pieces. A lot of value can be found in simple tests against the most important components.
Load testing tools such as k6support modularization of test scripts written in JavaScript. The script you write to test a login function with a random user, can become its own module in your load testing library. Share your custom libraries with your team through your version control system (VCS) or other means.
Test Validation
As you are writing your scripts, and before you run them on a larger scale, it’s important to run validations (smoke tests) to ensure that the test works as intended. These tests are typically run with a very low number of Virtual Users for a very short amount of time. The fastest way to do this is by running these locally with output to stdout. k6 supports local execution mode. (See how to download and install k6 here. It’s open source software, freely available on GitHub).
Phase 2 - Baseline Testing, Scaling Your Tests, and Complex Cases
Now that you’ve done the hard part- i.e. the planning phase, the next steps become much easier.
Baseline testing
You generally don’t want to run your first performance tests at full throttle with the maximum number of Virtual Users. It’s critical to always be thinking comparatively-- how will subsequent test results compare to these initial tests? Make your first test a baseline test. This is a test at an "ideal” number of concurrent users or requests per second, and run for a long enough duration to produce a clear stable result.
What is ideal, you ask? Generally it will be a relatively low number of VUs that represent normal load levels on your site or app that are easily managed. If you aren’t sure, try 1 - 10 Virtual Users. Does your application generally have 500 concurrent users at any given time? You should be running your baseline tests below that number.
The baseline test gives you initial performance metrics for you to compare to future test runs. The ability to compare will help highlight performance issues more quickly.
Scaling your Tests
After your baseline tests are complete, it’s time to start running larger tests to detect performance problems in your system. Utilize the stress test to scale / step your tests up through different levels of virtual user concurrency to detect performance degradations. As you find these degradations and make adjustments to your code and/or infrastructure, iterate on the test multiple times until a satisfactory level of performance is achieved.
Figure 4: Example Stress Test Chart
Regardless of the complexity of your test cases, the testing you do in this step will provide the most information to improve performance. Once you have finished iterating through tests at this stage, verified by acceptable test runs, you should move to a load test pattern to verify the system under test can handle an extended duration at the target level of load.
Figure 5: Example Load Test Chart
More Complex Test Cases
If you started by writing small, simple test cases, as recommended, now is the time to expand them. You may want to repeat this second phase to look for deeper performance problems, for example, ones that could only show up when multiple components are under load.
If you have been modularizing your test scripts up to this point, this step may be as easy as combining them into a "master” test case.
Phase 3 - Ongoing performance Testing and Automation
The final step in our methodology is one that is long term. Up until now you have spent a good deal of time and effort creating your test cases, executing your tests, fixing various issues, and improving performance. You can continue to receive returns on the time investment made by including performance testing into your Continuous Integration (CI) pipeline or just by running tests manually on a regular basis.
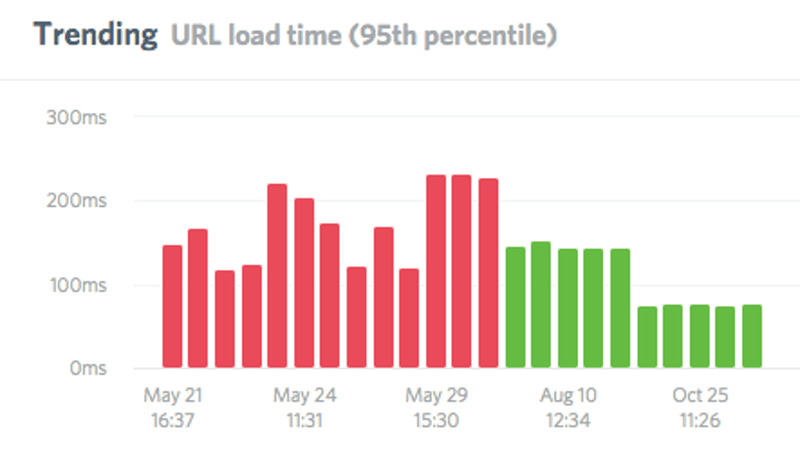
Seeing the performance trend over time and over multiple test runs can help you quickly see when a new release has caused a performance regression.
Figure 6: Performance Trend Chart
In the next article, we’ll take a deeper dive into how to integrate performance testing into your CI pipeline.


_v2.png)
_v2.png)
