In this tutorial, we'll show you how to store k6 logs in Loki for long-term storage and further analysis. We'll walk you through the steps to configure Loki in Grafana Cloud and enable k6 to send logs of your k6 tests to Loki.
Introduction to Loki and k6
Grafana Loki is a multi-tenant log aggregation system. It uses labels for each log stream instead of indexes stored in the content of the logs. Loki can be directly integrated with other platforms to ensure that these platforms can send logs to Loki.
Grafana k6 is an open-source load-testing tool to test the performance and reliability of your systems. k6 can natively send logs to Loki using the log-output option.
Using logs in your performance tests
Logs at k6 are commonly used to:
Debug your test script
Store additional data to investigate errors
Sometimes, test executions do not run as expected. This is especially true when running a load test: part of the "load" succeeds, and the rest might not. The more you saturate the system, the higher chances of responding with errors.
But k6 does not track all the transmitted data. k6 collects some general built-in metrics that will be insufficient for understanding the details of errors. Storing critical information is crucial to investigate errors later on.
Here are two minimal examples to indicate how error responses are logged.
Anti-pattern: logging excessively
Logging can help in many situations, but excessive logging is distracting. We recommend paying attention to when to use logs.
A large load test can run the test script thousands or millions of times. This could create a massive, unmanageable number of logs. This problem exacerbates when you schedule your performance tests to run regularly. Be aware that generating a vast number of logs frequently can significantly increase your logging costs without previous notice.
Set up Grafana Loki
You can install Loki on your own infrastructure or use Grafana Cloud. For simplicity of the tutorial, we'll use Grafana Cloud, whose free plan includes 50GB of logs.
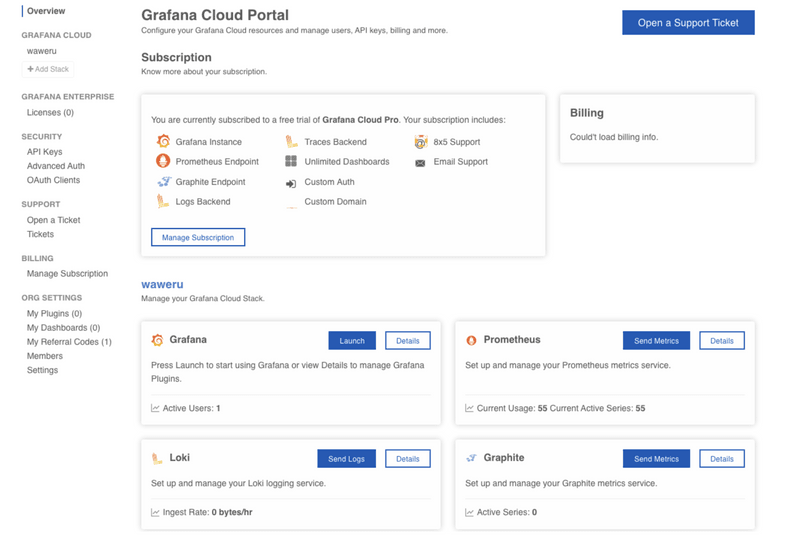
If you don't have an account, create one in the Grafana labs portal. Once you've created an account at the Grafana labs and logged in, you'll be able to access the Grafana cloud portal:
In the Grafana cloud portal, you can fetch the configuration required to view data in the Grafana dashboard and also access support services such as API keys, support tickets. and even billing services on Grafana.
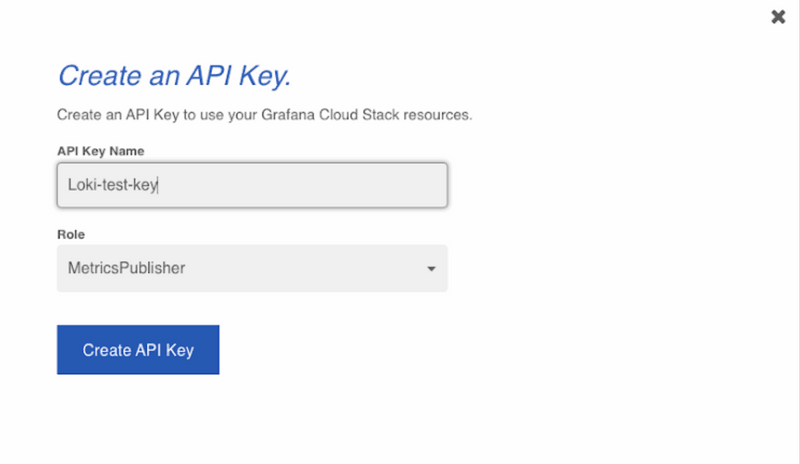
Once you have a Grafana account and have logged in, use the dashboard to create an API key. The API key ensures that Loki associates incoming data with the right user account.
We'll use this key to send data from k6 to Loki.
To create a key, go to the Security tab.
Give your key an identifiable name.
Store your key somewhere safe, so you can reuse it. Once you close the creation box, you won't be able to see the key again.
Now we can extract the necessary data that we need to configure logs to send to Grafana Loki.
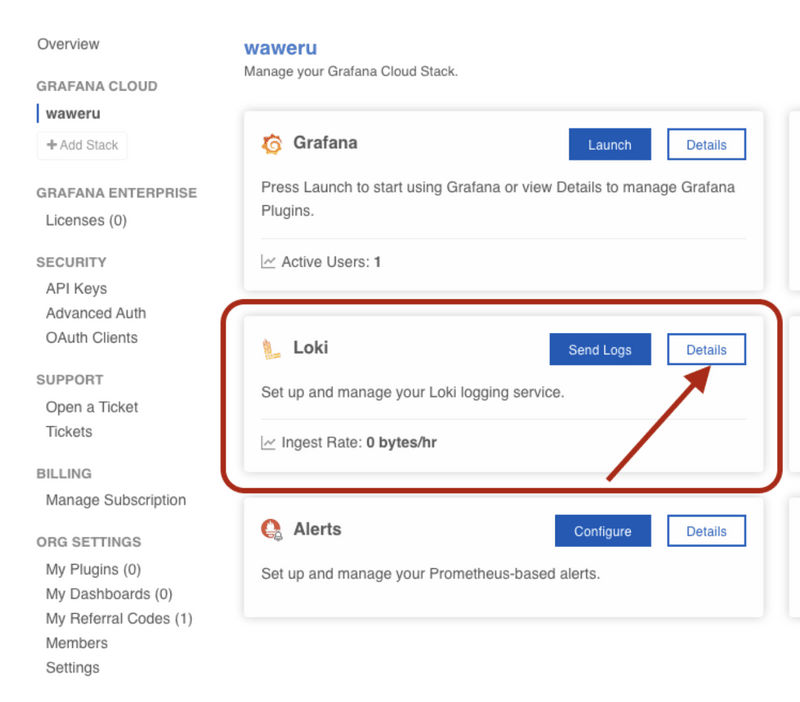
On the Loki card, select the details button to see which details we need to use to send data to Grafana Loki.
The configuration under details provides configuration snippets that we can then use to send data to Loki from executing k6 tests. In the details page we are interested in 3 things.
- The username - Grafana account username
- The API key - Grafana account API key, also referred to as a password
- The write url: url: https://<Your Grafana Username>:<Your Grafana.com API Key>@logs-prod3.grafana.net/loki/api/v1/push
As you can see, the write URL is generated from the Grafana username and API key. It's the same URL that we will use when sending our metrics to Loki from k6.
Send k6 log output to Loki
In k6, logs are mainly used to debug k6 tests. k6 logs different types of logs from various console methods such as console.log, console.info, console.debug, console.warn, and console.error. In our case, we'll write a simple test to return a list of crocodiles from an open k6 API.
If you haven't already, install k6 on your machine.
Make a file called test-loki.js with the following test script:
These five lines are all the k6 script needs. k6 will automatically identify the console.log and send the data to the Grafana Loki dashboard once we run the test with the proper configuration.
Start the test with k6 run, using the log-output option configured for Loki:
This script will execute your test locally and send the log output to Loki. The logs will be available for us to view in Grafana Cloud. For the additional options to use k6 with Loki, you can view the k6 documentation.
Query logs using Grafana
Now that we've run our k6 tests, you may have noted that we append a label tag label.qa-k6. This label tells Grafana Loki to create a label on the data named qa and have the value of the label be k6. With this label, we can quickly retrieve the qa data in Grafana Loki.
To view the logs sent by Grafana k6 to Grafana Loki:
Navigate to the Grafana dashboard: https://<grafana-username>.grafana.net/a/cloud-home-app
On the dashboard, select Explore.
Within the page on the explore dropdown, select the grafanacloud-.<grafana-username>-logs.
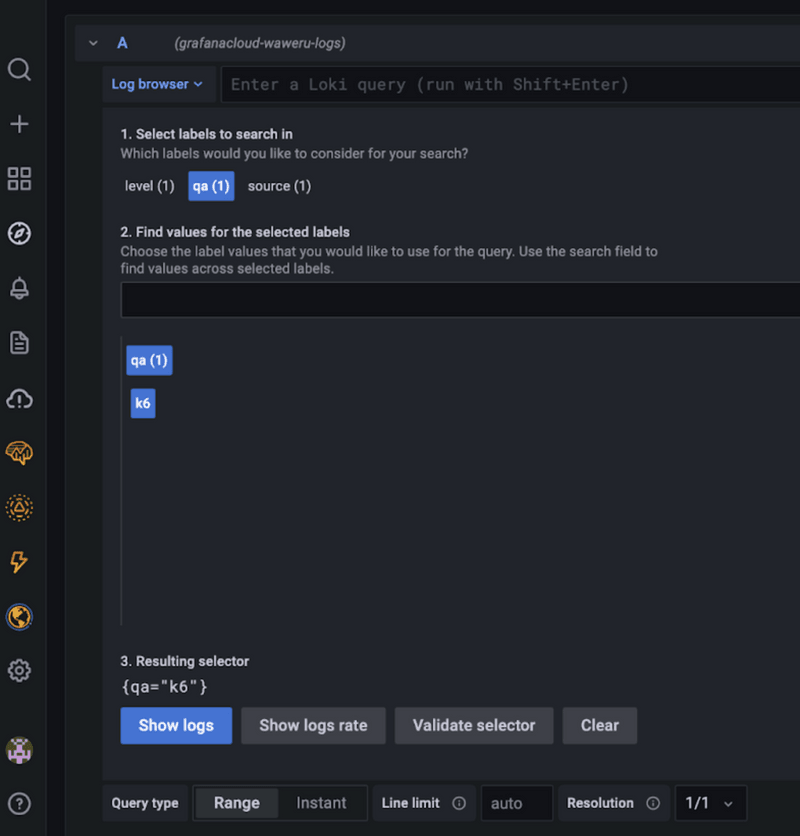
Select Log browser.
We should be able to see the selected labels that we defined for our data before sending it to the Grafana Loki dashboard :
Now that we can see the label that we gave to our data, we can inspect the data.
Select the label qa and its value k6.
Select the option Show logs.
We should be able to access the data we sent to Grafana Loki, the request body of our crocodiles:
Note that you can send k6 logs with multiple labels. For example:
Use labels for your specific use cases. The labels will help you quickly find a specific test's logs with the label selector.
Every time we run a Grafana k6 test with the Grafana Loki configuration, the logs are sent to Loki as a new entry with a unique timestamp, which we can then use to review the data sent. The dashboard also lets us view the data sent in respect to time on the dashboard, with an option to format the received data from the Grafana k6 tests.
In addition to viewing data on the Grafana Loki dashboard, we can also analyze the data sent to Grafana Loki by inspecting its statistics. To do this:
Select Inspector on the Log volume table.
Select Stats. Here, you can see how long the query took to be called by Grafana, the processing times, and the number of rows of all data returned.
To explore further, go to the Json and Data tabs. Here you can inspect the payloads and the responses of the logged data sent to Loki by k6. Below, we can see options of how we can download the logs from Grafana from the Data tab on Grafana Loki:
The options provided by Grafana Loki are to download the data as a CSV file or as a log file that can then be shared with other logging platforms if need be.
Explore data with LogQL
One of the coolest capabilities of Loki is the query language: LogQL. Inspired by PromQL, LogQL is a powerful query language to:
- return the content of the logs
- calculate values based on queries
Next, we'll provide a simple example of how to query and calculate results of k6 logs. LogQL is a powerful language, and we won't present all the details. To learn more about LogQL syntax and its capabilities, check out the documentation.
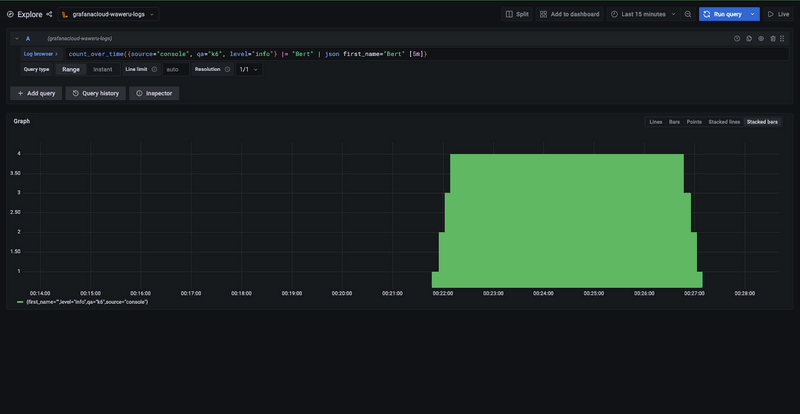
The Loki Log Browser lets you to select your list of labels and values to build a logs query for filtering the logs. In our case, instead of using a normal query, we want to calculate the number of times we received a string over a period of time. In this data we want to check the number of times the crocodile with the first_name Bert was logged by k6 and sent to Grafana. To do this, we will use the following query:
Here, the query will go through the logs, looking for the number of occurrences of the name Bert. Once this is found, we will then query for records with first_name Bert and return them as a json format. These logs will be within a 5 minute time interval between when the data was sent and when we checked the Grafana dashboard:
Tip: It is important to ensure you do not filter massive data using the json parser directly in order to keep your queries optimized.
As shown above, we are first finding all the results by first checking a match of the string Bert then later on filtering the results and preesenting them using the json format.
The time specified in the query determines the thickness of the bars and shows the count of the occurrences over a period of time. In our case, we can see that the highest count of the first_name Bert was between 17:55 and 18:00.
This was a simple crocodile-related example to share an overview of how you can calculate a metric based on your log data. To learn more about the possibilities, visit the LogQL metric queries documentation and read about the different functions rate, count_over_time, absent_over_time, sum, min, max, and more.
Conclusion
Through this tutorial, we've gone through the process of setting up your own Grafana account, generating API keys, and providing a role for your API keys. We have also covered how to execute tests and use our Loki configuration with Grafana k6 to send metrics to the Grafana Loki dashboard. Finally, we covered how to analyze and interact with data sent to the Grafana Loki dashboard, including how to inspect and download the data logs.
We hope you enjoyed reading this tutorial as much as we enjoyed creating it and until next time, keep learning!
