This article shows some of the complexity that the k6 cloud backend handles when you run a k6 Cloud test. In short:
- You run your k6 cloud test (either via CLI or from our cloud app).
- k6 cloud validates the script syntax, generates metadata for test comparison and creates an execution plan.
- We request cloud resources for spinning up all needed load generators, then send the execution plan and the scripts to the load generators.
- Next we run the test, orchestrating the behaviour live to coordinate the test across different load runners and load zones.
- As data comes in, we use custom-coded processing to aggregate the metrics from all load runners into our time series database. We process the results for your test and run performance insights.
- You start to see test-result visualizations.
Read on to learn the details…
The process starts when you tell k6 Cloud to run a test. You could use the CLI using the k6 cloud command:
or just use the swanky cloud app and press this button:
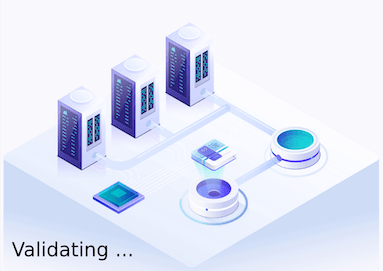
Once you click the button, an animation visualizes what’s going on (we at k6 all really like that animation!):
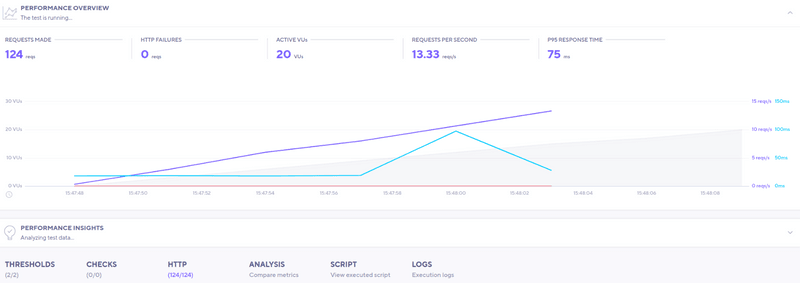
The animation shows some steps like Validating …, Allocating Servers… and others. Then the test is Running and boom - you start seeing your results as data comes in! Magic!
Let’s lift the curtain a bit to see what actually happens from the point you click that button to when your first results start showing up.
Checking Syntax and Creating the Test
We press the Save and Run button, kicking everything off.
The first thing the frontend app does when you click the button is check that your script configuration makes sense. Our Execution Requirement Service handles the validation of the k6 script. This service contains the part of the k6 open-source load runner responsible for checking testing configurations.
If the service finds any problems, k6 asks you to fix them. In our example, the service reports that our script is fine, so the frontend app tells the cloud backend to start the test-run process! Throughout this example we’ll assume everything is fine at every step.
(Note that if you instead start your cloud test from the CLI, the backend start process differs, but once the test gets going, the backend works the same, as shown later in this article).
At this step, the Validating animation starts. Now the backend is aware of your new test and is kicking into gear for real (yes, the frontend simplifies the steps a bit here).
When you run a test locally, k6 doesn't generate much metadata about the run itself. So it's not easy to compare different runs. In contrast, k6 Cloud has built-in test-comparison features.
In the k6 cloud, your script and all later versions of it are called a Load Test. Every time you run the Load Test, we register this as a new Load Test Run. The script version used and any notes you make are saved with the run along with run statuses or errors. This is linked to the metric result data we will be collecting during the run.
The nice thing with storing a series of runs like this is that you can compare performance over time. It’s particularly useful if you automatically run tests via CI or with k6 cloud’s test scheduling.
So at this step we create all this meta-information in our PostgreSQL database. We use Python for most of our backend - the meta-data is handled using Django.
Validating your script
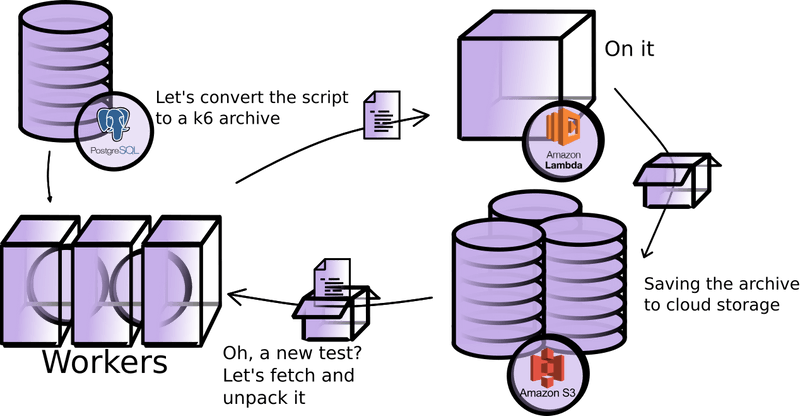
Knowing that we have a new test to run, we need to convert its script into something the k6 load runner can understand. Since we are operating on AWS, we use an AWS Lambda function to simply run k6 archive on the script to store the result in Amazon S3 (an online file storage).
Talking to external systems like AWS is a very asynchronous process ― we can’t be sure when a service actually gets back to us. To scale and track this for a large number of tests, we use RabbitMQ queues with Celery work-task management. Using a large number of scaleable worker tasks becomes even more important for processing data later.
You may notice from the diagram that we have the system first save the archive to S3 and then fetch it again. Saving and then immediately loading it again may seem a little wasteful - why do we do that?
First of all, having the archive in one place is useful since we’ll need to get to it from other places later. But it’s also worth remembering that there are many different ways to start a k6 cloud test. For example, when you do k6 cloud from CLI, you upload your archive directly to us ― no need for us to build it. By always storing the archive, we can re-use the same logic no matter how you start your test.
If you started your test from the CLI using the k6 cloud command, from here on, the backend process would be the same.
We now send our script back into the same Execution Environment Service we visited at the start. This time we not only check that the script’s config is (still) okay, we will also figure out the number of instances we need to run the test. This comes out as an ‘execution plan’.
A k6 Cloud test can be really big and involve a large number of load runners spread out over different load zones. Each of these k6 instances thinks that it is running on its own.
The ‘execution plan’ lets us know how we should control each load runner in order for them to all together represent the test you want. This works because k6 presents a REST API where you can tweak its execution in real time.
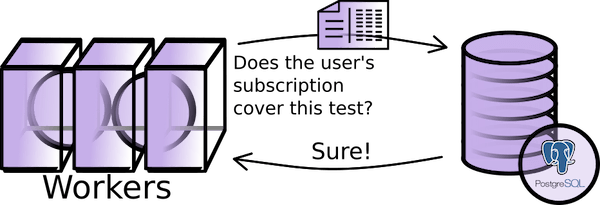
With our ‘execution plan’ in hand, we now know exactly what is asked of us: how many virtual users to use and for how long, how many load zones, and so on. We need to check if your subscription (or trial) supports running the test.
Gathering resources
Throughout all of this, you have been seeing Validating on-screen. Now that the test is done validating, this is soon to change!
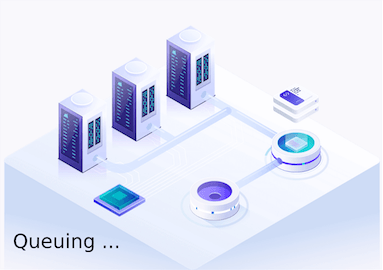
You will see Setting up the test - Queuing for a slot. Progress! If you’re running the maximum number of simultaneous tests you can run, you may be stuck at this screen for longer, until one of your previous test has ended.
In this step we reach out to AWS with our execution plan, requesting to get what we need. Again, this is a very asynchronous process and we need to verify that what we get is ready to use.
Spinning everything up
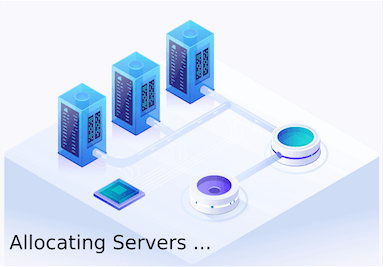
Once AWS has given us what we need, we need to make use of it. You are now seeing the animation for Setting up Test - Allocating Servers.
We spin up machine images of k6 load runners as well as k6-agents on the provided instances. Remember that k6 can be controlled dynamically via its REST API? The k6-agent is the one making this call.
As the instance spins up, it calls home to the backend to set up secure communications. This is necessary for us to control the instance later (such as instructing it to start or telling it to shut down if something goes wrong). Each instance uses its own certificate and private key generated on the fly; this is particularly important when users want to use their own private load zones with k6 cloud.
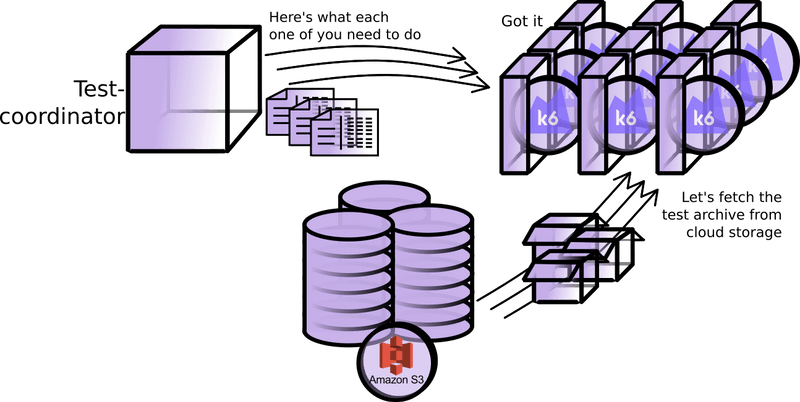
At this point we have almost everything ready to go. We just need an orchestrator to track the lifetime of the test. Enter the Test coordinator. The Test coordinator splits up the execution plan and informs each k6-agent of the part of the execution plan that its k6 loadrunner is responsible for.
The k6-agents now fetch the script archive from S3. Once all is in place, the Testcoordinator kicks off the test. Each k6-agent feeds the script to k6 and uses the load runner’s REST API to run only its assigned part of the larger test.
Full speed ahead
Now that the k6-agents have spun up their k6 load runners, the test is finally underway!
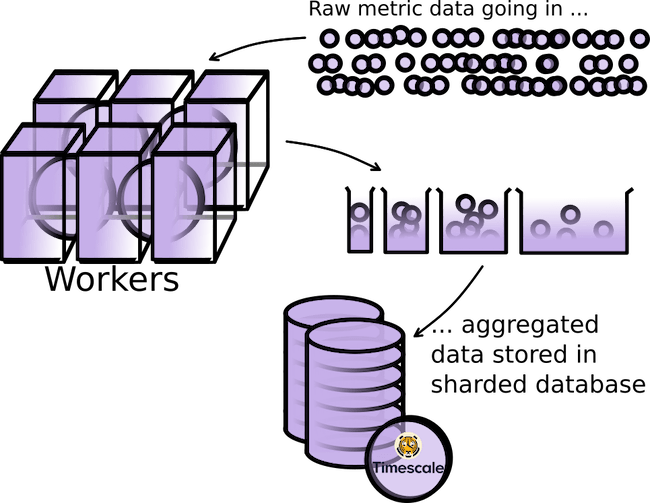
When each k6 load runner generates metrics, that data is aggregated and passed to the k6 cloud at regular intervals. This is the same data you get when you run the OSS k6 load runner locally. The difference is that the k6 cloud must collate data from all the load runners that make up your (potentially very large) test-run. It must also be done in as close to real-time as possible, since you want to see your results quickly!
Our first step is to get the collected data into our database. For metrics storage, we use a PostgreSQL database with an extension (Timescale) optimized for dealing with time series. Getting the data into the database is easier said than done though. With all the metrics k6 produces, the combined load runners of a single large test can create hundreds of millions of data points.
The metric data we get from the k6 load runners is noisy. High-frequency noise is of little interest in analyzing load tests results, so we want to average and ‘smooth’ it somehow. But we must be careful here. Unlike most metrics handled in computing, load-testing metric values are spread over several orders of magnitude. As an example, the response-time metric could vary from milliseconds to tens of seconds. Taking a regular average over such disparate values would skew results enormously: The large numbers would completely dominate the average and we could miss any interesting spikes happening on shorter time frames. And worse - we’d not know how big the error actually was.
In k6 cloud we have solved this dilemma by using HDR (High Dynamic Range) aggregation. In short, HDR aggregation means grouping data points into logarithmic ‘buckets’ that we store in our time-series optimized database. All subsequent operations are done on these ‘buckets’. There is currently no database offering this natively, so we had to make a fully custom solution; Getting the aggregation to perform well involved us implementing HDR in database modules we wrote from scratch in C.
Using HDR, we use a lot less database storage. But more importantly, by changing the size of the buckets, we can directly control our maximum error margin to one we are comfortable with.
Even after aggregating the data into the database, processing this in real-time is challenging. While we dynamically scale up our number of processing tasks as needed, it’s hard to properly predict how ‘heavy’ a test run will be, since you, dear user, can write your k6 script any way you like. Safe to say, we need to have a good margin to not lag behind when a huge amount of data suddenly flows in. And even though HDR aggregation reduces the total amount of data, we have still been forced to horizontally scale our database to make sure it can accept it in a timely manner.
As data is collected into the sharded database, we also process it in various ways. We calculate various derived properties (such as p95 percentiles) and store them in the database for quick access. We also run data through our Performance Insights algorithms. This is to raise alerts and help with the analysis of the results. You’ll see these outcomes pop up under your graphs.
Special cases are the checks and thresholds you’ve defined in your script. When you run k6 locally, the load runner will itself figure out if you crossed a threshold or failed a check. In the cloud case, this is not possible since each k6 load runner doesn’t have the full picture. Instead, the k6 cloud backend must verify thresholds and checks using the aggregated data.
Profit
We have now been running the test for a few moments. The first metrics have been successfully aggregated into the database. The first derived values have been calculated …
… and when the frontend realizes there’s data to pull from the database, it does so. Your display will change and … you have your first results!
We have finished the startup and all is good in the best of worlds. Later, when the test has finished, the interconnected systems will shut down and clean up the ephemeral resources … a process which comes with its own set of complexity.
But that’s another story.
Hopefully this gave some insight into what we do under the hood. Something to think about next time you lean back and and run the k6 cloud command or press that convenient Save and Run button!
