Integrations 03 February 2022

Store k6 metrics in TimescaleDB and visualize with Grafana

Harshit Mehndiratta

TimescaleDB is a open-source database that extends PostgreSQL for better storage, processing, and analysis of time-series data at scale. If you want to know more about TimescaleDB, I recommend you look at the official documentation.

k6 is an open-source and extensible load testing tool that generates the results of the testing (k6 metrics) as time-series data.

k6 can send metrics to various formats and systems. In this tutorial, we will send k6 metrics to TimescaleDB for scalable long-term storage, analytics, and easy querying with SQL.

Overview

To store metrics from k6 to TimescaleDB there are five steps you need to follow:

  • Step 1: Installing self-hosted TimescaleDB from a pre-built Docker container.
  • Step 2: Building the k6 binary with the TimescaleDB k6 extension.
  • Step 3: Run k6 tests and send the k6 metrics to TimescaleDB.
  • Step 4: Querying the TimescaleDB Database for k6 metrics.
  • Step 5: Visualize k6 results with pre-built Grafana dashboards.

Ready to get started? Let's go.


Note that the instructions in this tutorial are tested on Ubuntu Linux. Commands may vary a little bit according to OS.

Run the k6 test and store results in TimescaleDB

Install self-hosted TimescaleDB from a pre-built Docker container

  • Docker is available for a variety of platforms Linux, MacOS and Windows. Find installation instructions for the preferred operating system here. You can verify the Docker installation with:

    docker --version

    Response:

    Docker version 20.10.12, build e91ed57
  • Open your Terminal/Command Prompt and run the TimescaleDB Docker image:

    docker pull timescale/timescaledb:latest-pg14

    Run the docker commands as administrator or sudo if you get the error: permission denied while trying to connect to the Docker daemon socket.

  • Run the pulled image directly from the Docker container:

    docker run -d --name timescaledb -p 5432:5432 -e POSTGRES_PASSWORD=password timescale/timescaledb:latest-pg14
  • Verify whether the timescale container is up and running using the command below:

    docker ps

    The response should be similar to the snippet below:

    CONTAINER ID IMAGE COMMAND CREATED STATUS PORTS NAMES
    14096949ba44 timescale/timescaledb:latest-pg14 "docker-entrypoint.s…" 4 minutes ago Up 4 minutes 0.0.0.0:5432->5432/tcp, :::5432->5432/tcp timescaledb

Building k6 with TimescaleDB support

  • xk6-output-timescaledb extends k6 to support sending k6 metrics in real-time to TimescaleDB. To built a k6 binary with this extension, first, ensure you have installed Go and Git. the following steps are:

    # Install xk6
    go install go.k6.io/xk6/cmd/xk6@latest
    # Build the k6 binary with timescale extension
    xk6 build --with github.com/grafana/xk6-output-timescaledb
    ... [INFO] Build environment ready
    ... [INFO] Building k6
    ... [INFO] Build complete: ./k6
     

    xk6 creates the k6 binary in the local folder. For troubleshooting or other options for making custom k6 binaries, check out the xk6 instructions.

Running the k6 test

  • For the purpose of this tutorial, we will prepare a simple k6 test. For example:

    // script.js
    import http from 'k6/http';
    import { check, sleep } from 'k6';
    export const options = {
    stages: [
    { duration: '30s', target: 20 },
    { duration: '1m30s', target: 10 },
    { duration: '20s', target: 0 },
    ],
    };
    export default function () {
    const res = http.get('https://httpbin.org/');
    check(res, { 'status was 200': (r) => r.status == 200 });
    sleep(1);
    }
  • Now we can run the test using the k6 binary built previously. The format of the k6 run command is as follows:

    sudo ./k6 run <script_file_name>.js -o timescaledb=postgresql://<postgresql_user_name>:<password>@localhost:<timescaleDB_container_port_number>/<name_of_empty_database>

    Navigate to the folder of the k6 binary and run the following command:

    sudo ./k6 run script.js -o timescaledb=postgresql://postgres:password@localhost:5432/k6

    After executing the test, k6 prints the test result summary in the terminal:

    /\ |‾‾| /‾‾/ /‾‾/
    /\ / \ | |/ / / /
    / \/ \ | ( / ‾‾\
    / \ | |\ \ | () |
    / __________ \ |__| \__\ \_____/ .io
    execution: local
    script: script.js
    output: TimescaleDB (postgresql://localhost:5432)
    scenarios: (100.00%) 1 scenario, 20 max VUs, 2m50s max duration (incl. graceful stop):
    * default: Up to 20 looping VUs for 2m20s over 3 stages (gracefulRampDown: 30s, gracefulStop: 30s)
    running (2m20.9s), 00/20 VUs, 1414 complete and 0 interrupted iterations
    default ✓ [======================================] 00/20 VUs 2m20s
    ✓ status was 200
    checks.........................: 100.00% ✓ 14140
    data_received..................: 14 MB 99 kB/s
    data_sent......................: 132 kB 934 B/s
    http_req_blocked...............: avg=9.89ms min=200ns med=281ns max=750ms p(90)=351ns p(95)=474ns
    http_req_connecting............: avg=3.27ms min=0s med=0s max=243.88ms p(90)=0s p(95)=0s
    http_req_duration..............: avg=271.13ms min=222.81ms med=237.05ms max=1.34s p(90)=381.41ms p(95)=499.22ms
    { expected_response:true }...: avg=271.13ms min=222.81ms med=237.05ms max=1.34s p(90)=381.41ms p(95)=499.22ms
    http_req_failed................: 0.00% ✓ 01414
    http_req_receiving.............: avg=132.36µs min=46.67µs med=117.61µs max=3.06ms p(90)=176.7µs p(95)=215.16µs
    http_req_sending...............: avg=112.88µs min=36.5µs med=101.34µs max=2.24ms p(90)=154.29µs p(95)=188.38µs
    http_req_tls_handshaking.......: avg=6.6ms min=0s med=0s max=497.8ms p(90)=0s p(95)=0s
    http_req_waiting...............: avg=270.89ms min=222.46ms med=236.85ms max=1.33s p(90)=381.19ms p(95)=498.96ms
    http_reqs......................: 1414 10.037279/s
    iteration_duration.............: avg=1.28s min=1.22s med=1.23s max=2.34s p(90)=1.41s p(95)=1.55s
    iterations.....................: 1414 10.037279/s
    vus............................: 1 min=1 max=20
    vus_max........................: 20 min=20 max=20

Querying TimescaleDB

This section would provide some basic instructions about how to query the k6 metrics in TimescaleDB.

  • Connect to the k6 database through psql:

    psql -U postgres -h localhost
    \c k6

    Response:

    postgres=# \c k6
    psql (12.9 (Ubuntu 12.9-0ubuntu0.20.04.1), server 14.1)
    WARNING: psql major version 12, server major version 14.
    Some psql features might not work.
    You are now connected to database "k6" as user "postgres".
    k6=#
  • We can use the \d command to list all the tables in k6 database:

    \d

    Response:

    List of relations
    Schema | Name | Type | Owner
    --------+-------------------+----------+----------
    public | samples | table | postgres
    public | thresholds | table | postgres
    public | thresholds_id_seq | sequence | postgres
    (3 rows)
  • The samples table stores all the values of the k6 metrics. To get familiar with the schema of the samples table, let's list its columns:

    \d samples

    Response:

    Table "public.samples"
    Column | Type | Collation | Nullable | Default
    --------+--------------------------+-----------+----------+-------------------
    ts | timestamp with time zone | | not null | CURRENT_TIMESTAMP
    metric | character varying(128) | | not null |
    tags | jsonb | | |
    value | real | | |
    Indexes:
    "idx_samples_ts" btree (ts DESC)
    "samples_ts_idx" btree (ts DESC)
    Triggers:
    ts_insert_blocker BEFORE INSERT ON samples FOR EACH ROW EXECUTE FUNCTION _timescaledb_internal.insert_blocker()
    Number of child tables: 1 (Use \d+ to list them.)
  • To get the average value of each metric, we can query as follows:

    k6=# SELECT metric,AVG (value) FROM samples GROUP BY metric;

    Response:

    metric | avg
    --------------------------+---------------------
    http_req_connecting | 4.183675041411842
    http_reqs | 1
    http_req_receiving | 0.1324558245647678
    data_received | 9905.839497557572
    http_req_waiting | 270.77143393148924
    http_req_failed | 0
    vus_max | 20
    iteration_duration | 1286.9601006420933
    checks | 1
    http_req_sending | 0.11316185965925954
    http_req_duration | 271.01705154759924
    http_req_tls_handshaking | 8.432612371178312
    http_req_blocked | 12.635327665697291
    data_sent | 95.67271458478716
    vus | 12.342281879194632
    iterations | 1
    (16 rows)
 

You can now check these results with the results reported previously by the k6 output. For example:

  • The k6 output showed: http_req_duration..............: avg=271.13ms
  • The SQL query showed: http_req_duration | 271.01705154759924

The benefit of extracting k6 metrics from SQL queries is that you have complete flexibility to query and filter your testing results. To learn how k6 generates time-series data and what type of data, refer to the k6 metrics documentation.

Grafana Dashboards

The k6 TimescaleDB extension repository includes a docker-compose.yml file that can start TimescaleDB and Grafana, and build a k6 binary including the required extension.

  • Clone the repository to get started.

    git clone git@github.com:grafana/xk6-output-timescaledb.git
  • Put your k6 scripts in our case (the script.js file mentioned above) in the scripts directory.

  • Start the docker compose environment.

    docker-compose up

    Response:

    Starting xk6-output-timescaledb_timescaledb_1 ... done
    Starting xk6-output-timescaledb_k6_1 ... done
    Starting xk6-output-timescaledb_grafana_1 ... done

    It starts the Grafana and TimescaleDB containers, and build the k6 binary.

  • Use the k6 docker image to run the k6 script and send the metrics to the TimescaleDB as follows:

    docker-compose run k6 run -<test_script_path> --tag testid=<someid>

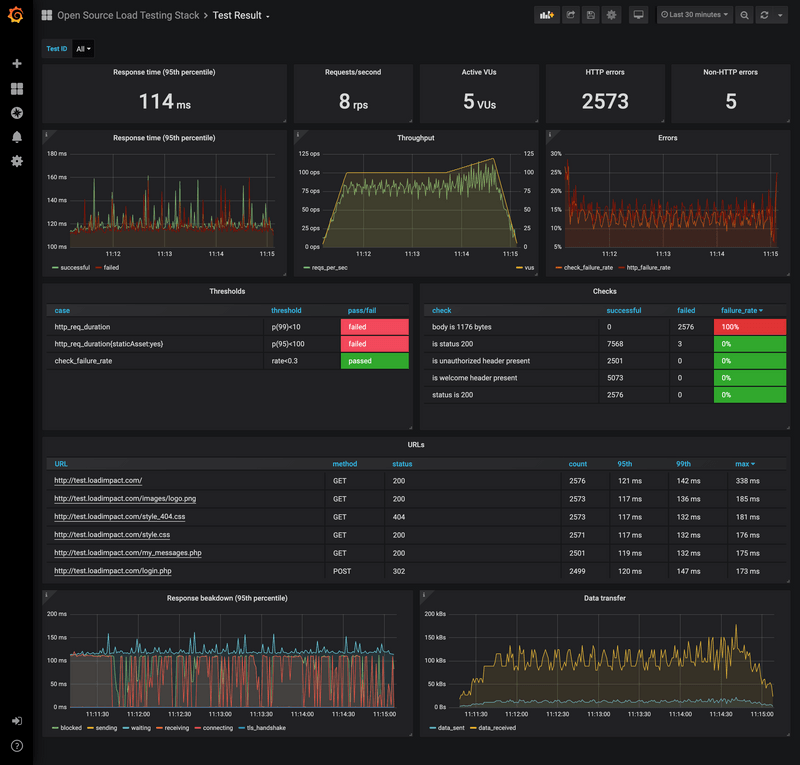
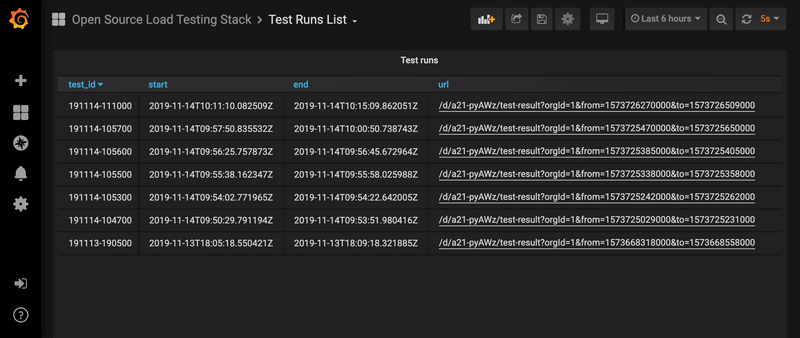
    The above command tags the metrics with a testid (the value can be whatever you want to use as a unique identifier for test runs like a date string, numeric ID etc.). This tag enables the Grafana dashboards to segment the result data into discrete test runs. It will allow to select and filter the results of a test run.

    Test result list

  • After running the test, you can check the results by visiting the Grafana at http://localhost:3000. Here is a sample output of a Grafana Dashboard in the browser.

    Test result dashboard

Summary

In this tutorial, we have provided the instructions to start storing the results of your k6 tests in TimescaleDB. If you have any questions about this project or feature requests, follow the xk6-output-timescaledb and open a new issue.

Happy testing!
< Back to all posts