📖What you will learn
- How to use google analytics to determine the concurrency for your load tests
Introduction
It’s always good to take the guesswork out of your load testing and test preparation.
The vast majority of our users rely on Google Analytics for their traffic data, as it’s become the industry standard over the years. The platform is great for seeing where your users are coming from, and it also offers plenty of data that can help you create realistic load tests.
Google Analytics tracks new visitors ("Users”) and how long they stay on your site. During their stay — the "Session" — they will perform actions (page loads, AJAX requests) that cause traffic to be generated that will load your servers.
We try to determine how many users are in the middle of a "Session" at any one time, meaning they are currently active on the site and generating traffic the servers have to handle.
Whenever someone asks us how many concurrent users they "should” use in a test to understand their performance baseline and prepare for a big wave of traffic, we like to follow a simple formula that can be quickly calculated from Google Analytics data.
🧠 Formula for calculating your baseline
Hourly Sessions x Average Session Duration (in seconds) / 3,600"** is the formula we recommend to get started
Where do I get this data in Google Analytics?
This is actually the easiest part of the process.
- Login to your Google Analytics account
- Click the "Reporting” tab across the top
- Select "Audience” in the sidebar menu
- Click "Overview”
- Set the time period you want to base your data on in the top-right corner
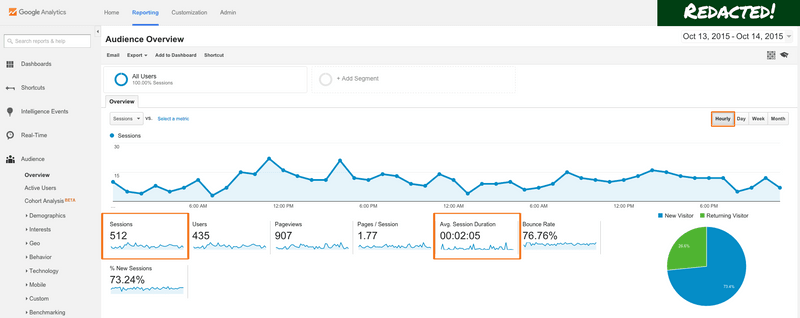
- Make sure "Hourly" is selected in the top-right of the line graph
- And the data you need is right in front of you!
Check out the screenshot below to get an idea of the view and where you’ll find sessions and average session duration.
Note: This screenshot is from a small site’s Google Analytics dashboard. We redacted the name in the top-right corner in the name of privacy!
And that’s it! As you can see, Google made this data pretty easy to find.
How to design your load test
One good way of determining what traffic to subject your site to during a load test is to check your peak hours of traffic in Google Analytics, figure out how many sessions you faced then, and perform a test that generates a similar kind of load/similar amount of traffic.You probably want to add some margin to it also — to ensure that you can handle higher traffic levels than your latest peak.
The reason we want to find the traffic peak and not just use the average level for the whole month is that, in most cases, average traffic will be quite low. It’s quite common for sites to have regular, recurring peak periods where they experience maybe 2-3x the average traffic levels, so it is important to load test for that level of traffic, at the very least.
Some sites may also have occasional (or regular) extreme traffic peaks. It can be due to the nature of the site — perhaps it’s a site declaring the result of an election, or a site selling concert tickets that are released at a certain date and time, or a site that is figured prominently in a TV advertisement aired twice a day.
It can also be because of user behavior. Maybe it’s a site for dinner recipes, which means everyone logs on just before dinner. Regardless, such sites can have peaks that are much higher than 10x the longtime average for the site. In this case it is even more important to load test at traffic levels way beyond the average to ensure the system doesn’t break down when it counts.
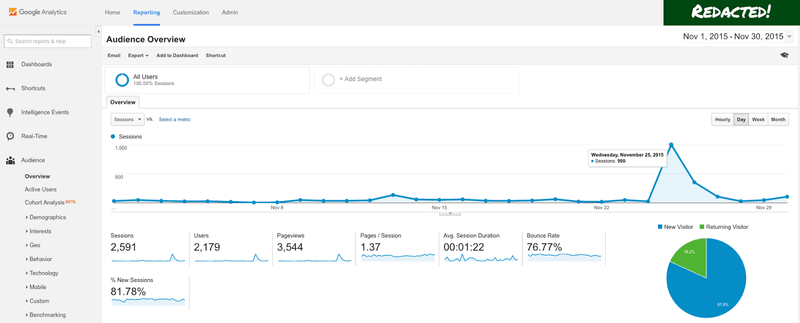
So how do we do this? Here’s the Google Analytics dashboard for a small example site that has had a (relatively) big traffic spike. For this little site, nearly 40 percent of November 2015’s traffic came on a single day — Nov. 25.
Here’s the basic math we used to analyze the data:
The site averaged .08 concurrent sessions for the entire month.
- 2,591 monthly sessions x 82 seconds per session / 3600 = 59.0172
- 59.0172 / 720 (30 days in November x 24h per day = 720) = .08 average concurrent users in November
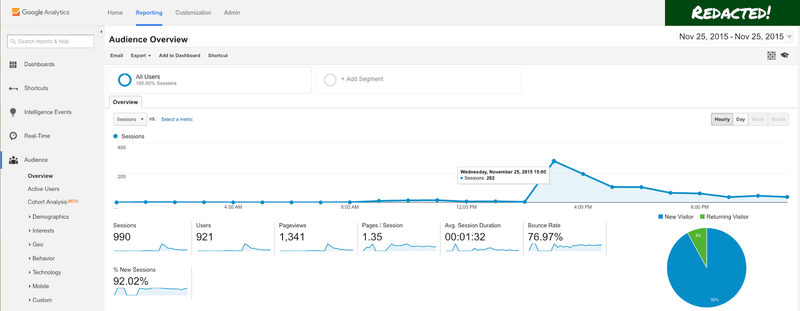
However, if you calculate the average concurrent sessions for just Nov. 25, you get 1.05 — that is more than 10x the monthly number. And if you calculate the average concurrent sessions between 3 p.m. and 4 p.m. on that day, when most of the traffic spike happened, the average number of concurrent sessions is 7.2. While not a huge number by itself, it is almost 100x the monthly average.
This illustrates how important it is to look at the right numbers, or the right time frames, when designing your load test. Even if you do not have a huge spike like in this case, chances are that you will still see temporary peaks that can reach perhaps 10x your average traffic level.
And of course, no matter the size of your company or the amount of traffic you typically handle, a sudden increase in traffic by nearly 100x definitely has the potential to degrade performance for the user, so spike tests are always a good idea before marketing initiatives, funding announcements, new feature rollouts and just for the sake of always being prepared.
Closing thoughts
Of course, we’re always here to help, too. We’ve worked with engineers (and non-engineers!) in every industry and companies of every size around the world.
If you’re stumped on how to plan your load tests and scenarios, there’s a good chance we’ve seen a similar situation and handled it before.


