This post was originally published at dev.to.
📖What you will learn
- How to load test applications hosted in a Kubernetes cluster
- How to verify autoscaling implemented with Keda
- How to identify potential performance bottlenecks
Overview
This article demonstrates how to Load Test an application deployed in a Kubernetes cluster, verify that the autoscaling is working, and identify potential performance bottlenecks.
When you deploy an application to production on Kubernetes, you'll need to monitor traffic and scale up the application to meet heavy workloads during various times of the day. You'll also need to scale down your application to avoid incurring unnecessary costs. Doing this manually is impractical since heavy traffic can come at any time including late at night when your entire team is asleep. And even if you are awake, a spike might come and go before you had a chance to address it.
The best approach is to automate scaling. This can be triggered by monitoring custom metrics such cpu usage, network bandwidth or http requests per second. Scaling an application running on a Kubernetes platform can be done in the following ways:
- Horizontal : Adjust the number of replicas(pods)
- Vertical : Adjust resource requests and limits imposed on a container
In this article, we'll focus on horizontal scaling based on a custom metric. Which metric you should choose to trigger scaling is outside the scope of this article. We will use the http request rate metric in this example, however other metric types can be used. We'll cover how to obtain these metrics and visualize them for analysis. We'll use the following to perform this task:
k6 OSS: an open-source load testing tool. We'll use it to simulate heavy traffic(load) for our Kubernetes application. There's also Grafana Cloud k6 which you can use to scale load testing beyond your local computing and networking infrastructure limitations.
Prometheus: an open-source monitoring platform. We'll use it to scrape metrics from our application and the Kubernetes API in real-time as while the load testing tool is running.
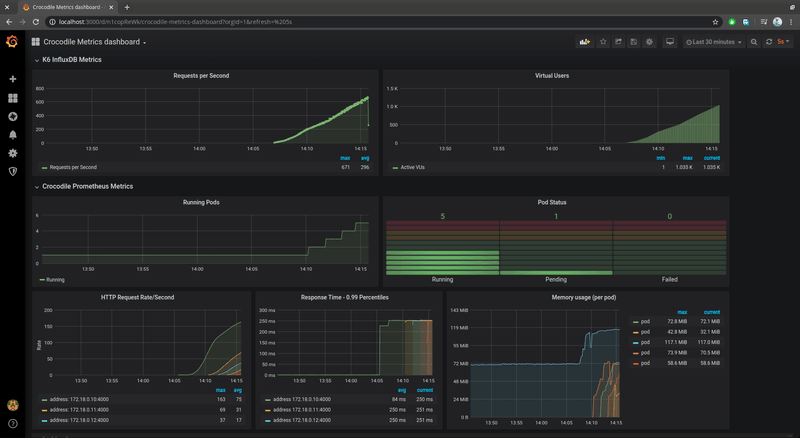
Grafana: an open-source analytics platform. We'll use it to visualize real-time metrics being collected by Prometheus so that we can see the performance of our application across time. Below is a screenshot of how metrics are visualized on a Grafana dashboard.
You can follow along this entire tutorial on a single machine. Just note that results will be skewed since your CPU will handle both running the application and load testing it. For accurate results, these tasks need to be performed on separate machines. For learning and simplicity purposes, one machine will be sufficient.
The source code of the application we'll be load testing is provided in our GitHub repository. The load testing script is included there as well.
Below is a complete illustration of the entire setup:
Prerequisites
This article assumes you at least have some basic knowledge about running and configuring a Kubernetes cluster. We'll be using Minikube for this guide. However, feel free to use any other k8s implementation that can run on your computer.
Before we proceed, you'll need to have the following installed on your machine. For windows users, you can use Chocolatey package manager to install most of these requirements. For macOS, use brew. For Linux, use the instructions provided in the following links:
Application Setup & Deployment
Setting up the project
If you haven't, download the example project to your workspace now:
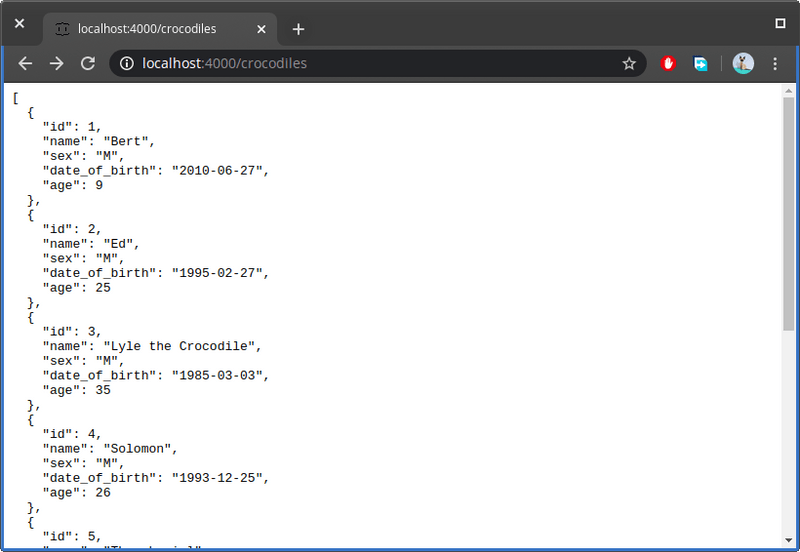
Open the URL http://localhost:4000/ to confirm the application is running. If you click on the crocodiles API link or visit the url http://localhost:4000/crocodiles, you should see the following:
Let's quickly inspect the code. Open the file db.json in your favorite code editor. This is where data is stored. You can add more records if you want. Next open server.js. This is the complete project code where the server logic lies. You'll see it's a simple project that uses json-server package to provide CRUD API services.
If you observe this section of code, you'll notice that an artificial delay has been implemented. Because the API application is so simple, we need to slow it down a bit just to help us simulate the results of a real-world application.
The next section of the code I want to show you is how to export the metrics from our application to Prometheus. Later on, we will query these metrics to monitor the status of the application.
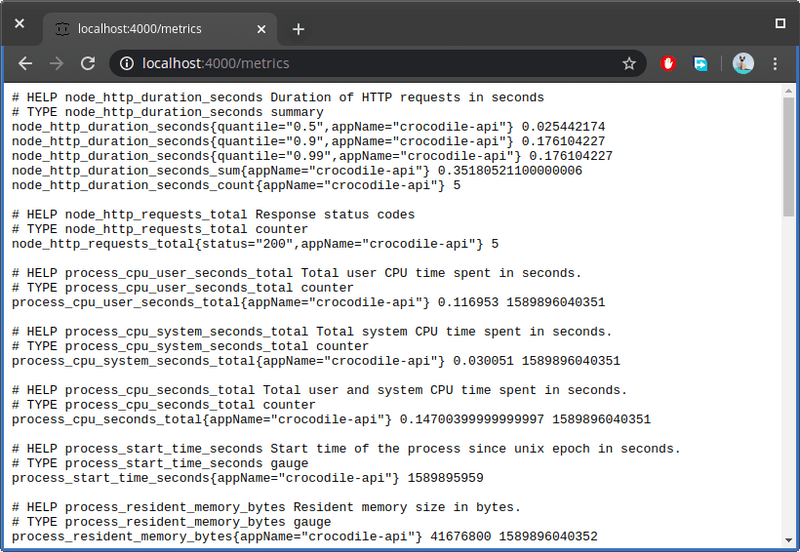
If you would like, you can define additional metrics for your application. The above code will output several default metrics. In your browser, open the URL http://localhost:4000/metrics to view these metrics:
For this application, we are using the npm package @tailorbrands/node-exporter-prometheus to help us export metrics from our application in a format compatible with Prometheus scraping requirements with very little effort on our part. You can find other Prometheus client library for Node.js applications in the npmjs registry repository. If you are working with a different programming language, you can find official and non-official Prometheus client libraries on Prometheus website.
The metrics displayed in the above screenshot will update when you interact with application. Simply refreshing the URL http://localhost:4000/crocodiles in your browser or executing a curl command on the site will cause the values of the metrics to update. For example, the metric node_http_requests_total keeps track of the number of times a HTTP request is performed on the application. Do note the metrics page doesn't use AJAX. So you'll have to refresh from time to time to see the results.
When you setup Prometheus, it will fetch the values of this metrics every 5 - 15 seconds and store it in a time-series database. This is what is referred to as scraping. With this information, Prometheus can plot for you a graph so that you can see how the metric values change over time.
If you inspect the metrics provided by our application, you'll notice we have different metric types. For this guide, we'll focus on the metric node_http_requests_total which is of type counter. A counter is a cumulative metric that always keeps going up. It can be reset to 0 if the application is restarted.
Now, we run the k6 load testing tool to generate some traffic, and we will visualize how this counter metric changes over time. At the root of the application project, locate the script performance-script.js which contains instructions on how to perform the load test.
Below are 2 examples of the k6 load test configuration. The first option is a quick 3 minute load test you can use to quickly confirm metrics are being captured. The second option allows us to scale the number of virtual users over a duration of 12 minutes. This will give us enough data to analyze performance and behavior of our autoscaling configuration.
Deploying our project
Before we can run the load testing script, we need to deploy Prometheus to scrape the application's metric. Our application needs to be deployed as well in order for Prometheus to discover our application. To deploy our project to our Kubernetes(minikube) node, simply execute the following commands:
If you have trouble executing the above commands, just visit the file Makefile and execute the commands under image and apply sections. Below should be output of the last command:
Take note of the IP address and the port. In the above case, we can access our application through a web browser using the following address: http://10.98.55.109:4000. Unfortunately, the page will likely refuse to load since we haven't fully configured how our load balancer will expose our service. A quick work around is to create a tunnel by running the following command in a separate terminal:
Once the tunnel is up and running, you should be able to access the application in your browser. Proceed to the next section and deploy Prometheus.
Deploying Prometheus and Kube State Metrics
To deploy Prometheus to our minikube node, follow this guide. You'll also need to deploy Kube State metrics. This is a service that accesses the Kubernetes API and provides Prometheus with metrics related to API objects such as deployments and pods. We need this service to track the number of running pods.
Deploying KEDA
Since we are deploying, let's also deploy KEDA, a Kubernetes Event-driven Autoscaling service. It works alongside Horizontal Pod Autoscaler to scale pods up and down based on a threshold that we'll need to specify. Instructions for deploying using YAML files can be found on this page. For convenience, these are the commands you need to execute to deploy KEDA:
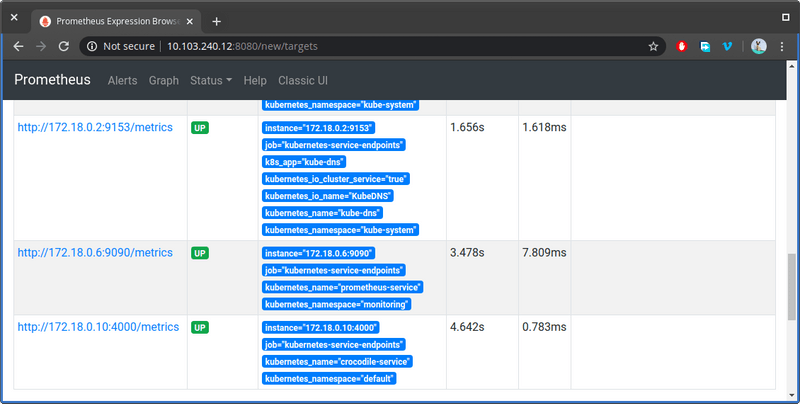
Use the command kubectl get po -A to ensure all the pods we have deployed are running. Use the command kubectl get service -n monitoring to find the ip address and port where Prometheus dashboard can be accessed. Construct the URL and launch the Prometheus dashboard in your browser. First let's confirm that Prometheus has discovered metrics from our application. From the top menu, go to Status > Targets page and scroll down to the bottom and look for the label crocodile-service:
If you see a similar status like the above, you are good to go on the next step. You should also confirm that the service kube-state-metrics has been discovered as well. On the top menu, click the Graph link to go to the graph page. This is where we enter query expressions to access the vast information that Prometheus is currently scraping.
Before we execute a query, fire up the k6 load testing tool to get some data to work with. You'll need to execute the load test script like this:
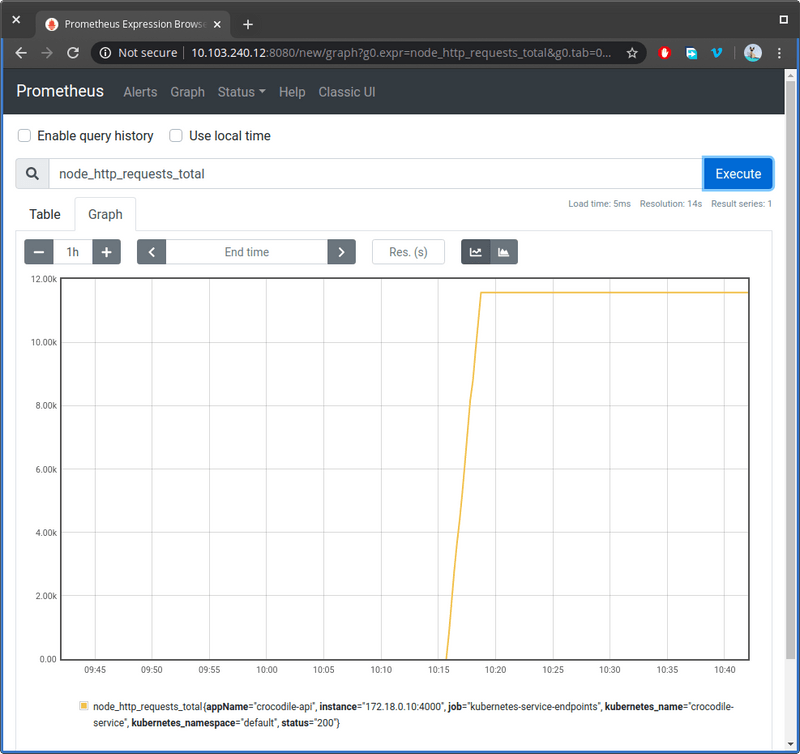
On the Graph page, enter this expression: node_http_requests_total. It should autofill for you as you type. Click on the Graph tab and you should see the following output.
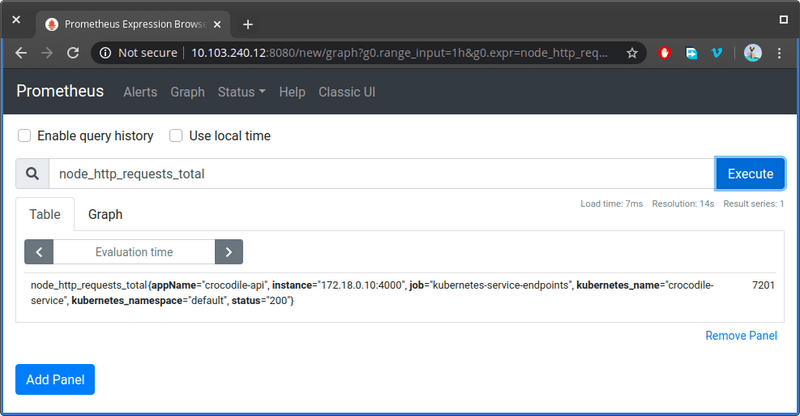
This is how the results are visualized after the test has completed. Notice how it flattens at the top. This is because the metric stopped incrementing when the test ended. If you click on the Table tab, you should see two fields that look like this:
The node_http_requests_total metric keeps track of the total number of requests per HTTP status code. If you were to run the test, the line graph will start shooting up from where it left of. This metric doesn't seem useful in it's current form.
Fortunately, we can apply a function to make it useful. We can use the rate() function to calculate the number of requests per second over a specified duration. Update the expression as follows:
rate(node_http_requests_total[2m])
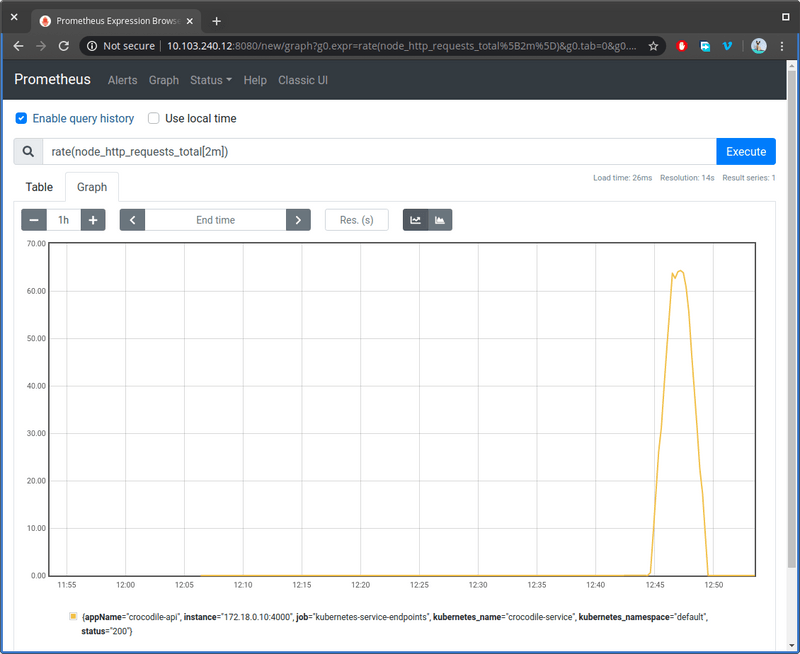
This function will give us the number of requests per second within a 2 minute window. Basically, it calculates how fast are the increments increasing per second. When the increments stop, the rate() function will give us 0. Below are the results of the load test with the rate function applied in the expression:
As you can see, our loading test script peaked at approximately 65 requests per second. When the load test script completed, the graph line goes back to 0. This is now a useful metric we can use to determine if scaling our pods is needed.
In the next section, we'll setup a more advance visualization dashboard that can display multiple metrics at once with automatic refresh rate.
Deploying InfluxDB and Grafana
In this section, we'll install InfluxDB which is an open-source time series database. InfluxDB is widely supported by many tools and applications. This provides new opportunities for collecting additional metric data from other sources such as Telegraf.
Grafana is an open-source analytic and monitoring platform that allows engineers to build dashboards for visually monitoring metrics from multiple sources in real-time. It supports the use of expressions to interpolate raw metric data into information that is easy to consume.
Both InfluxDB and Grafana can be deployed on the Kubernetes node. However, its easier and faster installing them locally. Do not use the Docker option as it's not easy for containers to communicating with Kubernetes services. Below are the download links:
- Download InfluxDB : Get 1.8 OSS version
- Download Grafana : Get latest version
Once you have installed both applications, make sure the services are running. For Ubuntu:
You can interact with influxDB database server via the influx command line interface. You can also interact with influxDB via http://localhost:8086 by passing query parameters.
Grafana is accessed by visiting http://localhost:3000. The default username and password should be admin admin. If this doesn't work, just edit the file /etc/grafana/grafana.ini and ensure the following lines are enabled:
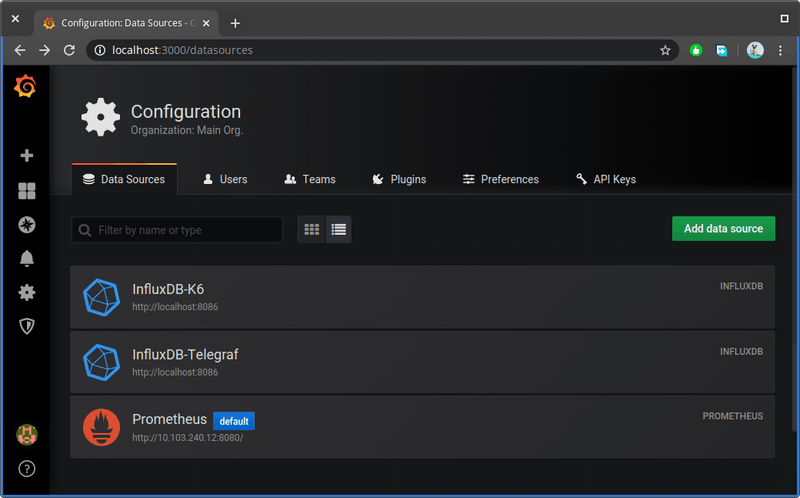
You'll need to restart grafana server for the the change to take effect. Once you log in, you'll need to go to Configuration > Data Sources and add the following sources:
- InfluxDB K6 Database
- Prometheus data source
Feel free to use other sources. In the screenshot provided, I've additionally installed Telegraf which is a service that collects real-time metrics from other database systems, IoT sensors and system performance metrics for CPU, memory, disk and network components. We won't use it for this article though.
Below are the settings that I've used for InfluxDB data source. The rest of the fields not mentioned here are left blank or in their default setting:
- Name: InfluxDB-K6
- URL: http://localhost:8086
- Access: Server
- Database: k6
- HTTP Method: GET
- Min time interval: 5s
Click the Save & Test button. If it says 'Data source is not working', it's because the database has not been created. When you run the following k6 command, the database will be created automatically:
Below are the settings that I've used for Prometheus data source.
- Name: InfluxDB-K6
- URL: http://<prometheus ip address>:8080/
- Access: Server
- Scrape interval: 5s
- Query timeout: 30s
- HTTP Method: GET
Click Save & Test and make sure you get the message "Data source is working". Otherwise, you won't be able to proceed to the next step.
The next step is to create a new dashboard by importing the Crocodile Metrics Dashboard from this link. Copy and paste the JSON code and hit save. This custom dashboard will allow you to visually track:
- HTTP Request Rate (sourced from both k6 and application via Prometheus)
- Number of virtual users
- Number of active application pods and their status
- 99th percentile response time (measured in milliseconds)
- Memory usage per pod (measured in megabytes)
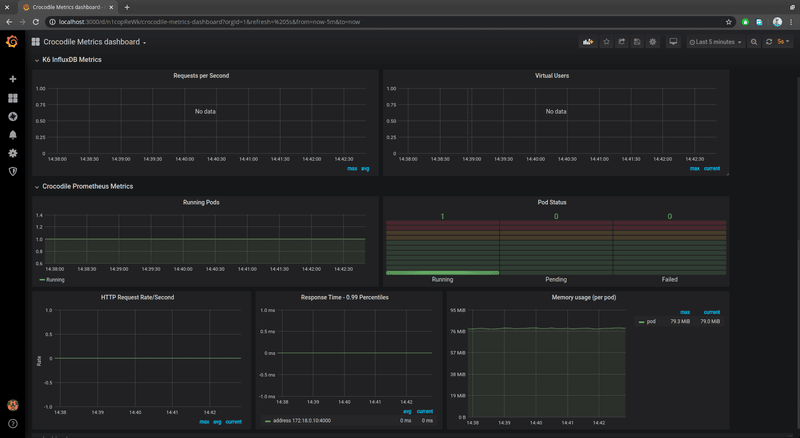
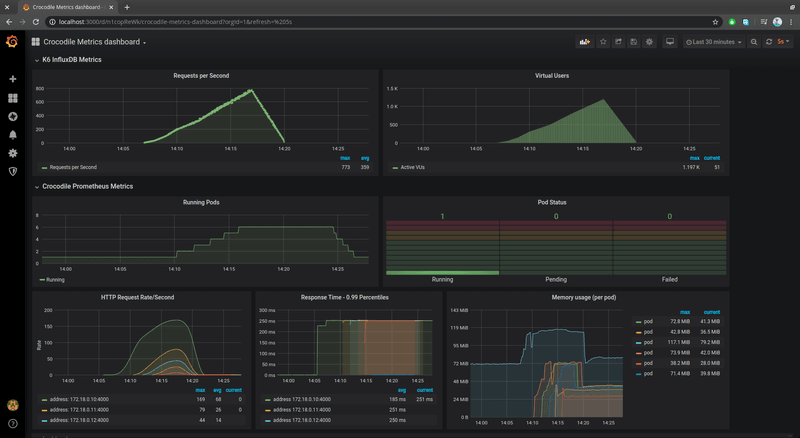
All the panels are easy to configure. You can change widget type, adjust the query and display more values. You can also re-organize the layout and add new panels. Below is how the Crocodile Metrics Dashboard should look like when installed:
In the next section, we'll configure KEDA to monitor and scale up our application.
Configuring Horizontal Pod Autoscaling with Keda
Before we configure auto scaling, let's run a quick load test. Open performance-test.js and ensure the following code is active:
Run the k6 script using the following command ensuring InfluxDB is collecting K6 metrics.:
The Grafana dashboard should start populating with data. As the number of http requests per second increases, the number of pods stays constant. You can wait for the load test to complete or you can cancel mid-way.
Let's now configure KEDA to monitor and scale our application. Open the YAML config file keda/keda-prometheus-scaledobject located in the project and analyze it:
Take note of the query we provided, sum(rate(node_http_requests_total[2m])). KEDA will run this query on Prometheus every 10 seconds. We've added the sum function to the expression in order to include data from all running pods. It will check the value against the threshold we provided, 50. If the value exceeds this amount, KEDA will increase the number of running pods up-to a maximum of 10. If the value is less, KEDA will scale our application pods back to 1. To deploy this configuration, execute the following command:
Once again, run the k6 script test just like before and observe how the number of pods increases as the number of requests per second increase as well. Below is the final result after the test has completed.
Take note of the Running Pods chart. The number of application pods increased as the load increased. When the load throttled down, the number of pods decreased as well. And that's the beauty of automation.
Conclusion
With the information you have at hand, you can benchmark any application and monitor the performance with accuracy. In addition to the application metrics, you can also utilize metrics like CPU, Memory, Network and Disk Usage to further enhance your abilities to draw conclusions from your tests.
For a real world application, you would have a separate pod containing the database. The data for this type of pod needs to synced when scaled out. You would also need to determine the at what request rate threshold it would make sense to scale.
The more metrics you can monitor, the easier it is to identify bottlenecks affecting the performance of your application. For example, if your application has high CPU usage, optimizing the code can greatly boost the performance. If disk usage is high, using memory caching solutions can help a big deal.
The point is, scaling the number of application pods shouldn't be the only solution when it comes to handling heavy traffic. Scaling vertically or increasing the number of nodes should be considered and could greatly improve performance during heavy loads. By using k6 load testing tool, and using Grafana to analyze results, you can discover where bottlenecks for your application are located.
