📖What you will learn
- How to configure k6 to send HTTP traffic through a web proxy
- What kind of web debugging proxies are available on your OS
- Some things to look out for when debugging your performance test
One of the more challenging aspects of load testing happens very early on: getting your scripts working. When you run your scripts, you may observe unexpected error status codes (typically in the 4xx-5xx status code range). Other times, you'll run your script and see it receive the expected responses (usually HTTP 200), yet the "thing" your script is meant to create simply doesn't show up anywhere, like on the database or as a record on the site. You start wondering: why on earth is that?
HTTP conversations can be quite complex, particularly when dealing with website HTTP traffic (as opposed to APIs) and when there is a sequence of requests taking place with dynamic identifiers (in other words, Correlation).
Debugging HTTP requires looking at a lot of places to see what could be going wrong. Doing so can be challenging when relying purely on console.log statements or using --http-debug=full, and so this article presents another way of showing the HTTP traffic: using a web debugging proxy.
What is a Web Debugging Proxy?
I'll call them WDPs from now on. ;-)
In essence, a WDP puts itself into the middle of the conversation between the client (like your browser, k6, or any proxy-aware application running on your machine) and the server. In hacker/technical terms, this is the Man-In-The-Middle (MITM) approach. Assuming traffic is flowing through the proxy (we'll get to that in a bit), the HTTP data will be visible for you to inspect. This goes for encrypted HTTPS traffic as well.
Aside from providing a purpose-built UI for viewing HTTP requests and responses, WDPs also cater for an independent view of the conversation as a result of this MITM approach. This can be handy in situations where the server expects some kind of encoded value but you don't know what encoding might be happening behind-the-scenes, or when you need to compare a script replay with a recording taken with the browser (most WDPs support importing HAR files).
There are numerous WDPs available today, a selection of which can be found below:
| WDP | OS | License |
|---|---|---|
| mitmproxy | Cross-platform | Open-source |
| Fiddler | Fiddler Classic: Windows, Fiddler Everywhere: Cross-platform | Windows: Free, Cross-platform: Commercial |
| Charlesproxy | Cross-platform | Commercial |
| Proxyman | macOS | Commercial |
Although technically not a WDP, Wireshark deserves a mention here as another debugging tool that can sometimes be useful, however the process of decrypting HTTPS traffic is a bit more involved. As Wireshark captures all network traffic and not just HTTP/S, it can also be difficult to find the packets you're looking for without setting up filters.
All of the WDPs listed in the table operate in the same way, with most also providing different ways of proxying (such as reverse proxying). To deal with encrypted HTTPS, they all require the installation of a certificate that enables the proxy to act as a Certificate Authority (the mitmproxy documentation provides a great explanation on how exactly that works).
As a long-time Windows user (gasp!), my favorite has been Fiddler Classic, and you'll see a few screenshots of it in action later in this tutorial. Installation and configuration of the proxies is beyond the scope of this article, instead we'll focus on how to configure k6 to send its HTTP/S traffic through the proxy once it is up and running.
Sending k6 traffic through a proxy
To have k6 send its traffic through a web proxy, we'll need to tell it on which TCP port the web proxy is listening.
Behind the scenes, k6 runs Go, and we use the built-in Go HTTP client for communication. Unlike some applications that use host OS proxy settings, Go programs depend on the presence of specific Environment Variables to determine whether to use a proxy and where it is listening. These magical Environment Variables are:
| Name | Description |
|---|---|
| HTTP_PROXY | The proxy address given either as complete URL or as host:port that will be used for HTTP requests unless overwritten by NO_PROXY. |
| HTTPS_PROXY | The proxy address given either as complete URL or as host:port that will be used for HTTPS requests unless overwritten by NO_PROXY. |
| NO_PROXY | Hosts that should bypass proxies. This is a comma-separated string of IP addresses and/or host names. See the httpproxy docs for more info. Example: "1.2.3.4, 2.3.4.5:80, myhost.com". |
⚠️ Capturing both HTTP and HTTPS
Make sure to set both HTTP_PROXY and HTTPS_PROXY environment variables to ensure both insecure and secure HTTP are captured.
The Environment Variables are usually set through a terminal where they will only apply to programs also launched from the same terminal. So, it is as simple as setting the relevant variable (or both, if testing a mixture of HTTP and HTTPS) to the correct host:port, followed by issuing your k6 run command.
As the web proxy runs locally, the host portion of the variable is localhost. The port will depend on which WDP you are using. For example, Fiddler and Charlesproxy use port 8888, whereas mitmproxy uses port 8080.
To enable the proxy, set HTTP_PROXY and/or HTTPS_PROXY and then run the k6 command:
warningRemember to switch out of the proxy before running your load test!
These web proxies are not designed for high throughput. You will experience longer response times, and your host OS may run out of resouces trying to log everything happening in the WDP UI.
Switching between using a proxy and not using one can be achieved by setting the relevant Environment Variables to empty, i.e. HTTP_PROXY="" and/or HTTPS_PROXY="".
What to expect
As soon as your script begins sending HTTP requests, you should see them listed in the WDP. If you don't see anything, yet your script appears to be running as expected, this means that traffic is bypassing the proxy. This can happen if the root certificate was not installed properly (this can happen on locked down systems), or there was a misconfiguration with the Environment Variables.
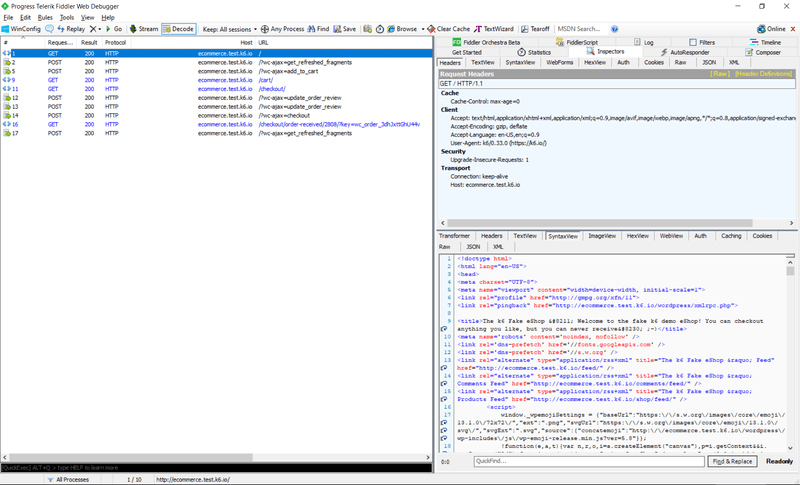
What you see will be reminiscent of the output a browser's Developer Tools > Network tab might show. Here's the output from running the example-woocommerce set of scripts:
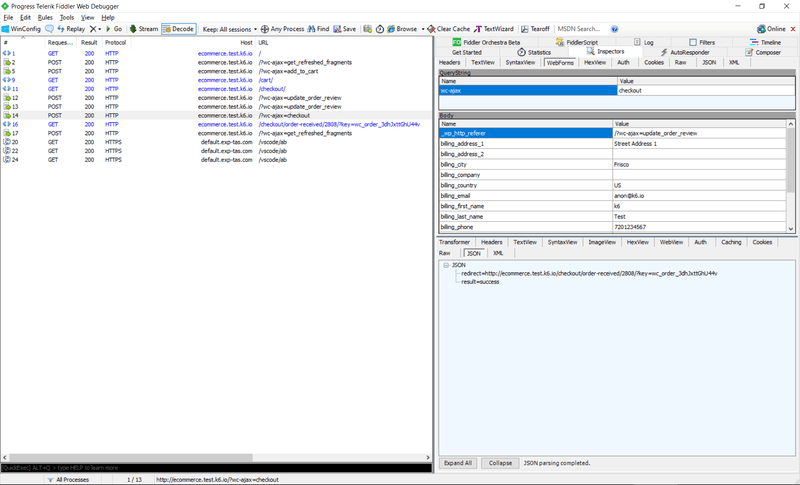
Each entry will allow you to see the HTTP request parameters as well as those of the corresponding response. Headers, POST data, and response bodies are the most interesting of these parameters, and there will usually be ways of formatting data depending on their Content-Type. Being able to display JSON in its "beautified" form can really help make sense of things, especially when you don't know the inner workings of the target system!
Even WebSocket frames can be seen when selecting the request that results in a HTTP 101 Switching Protocols response.
What to look for
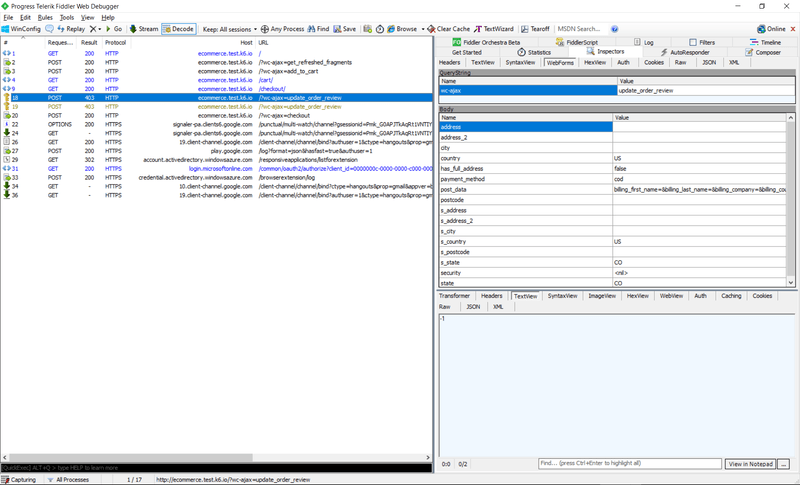
The default k6 output will let you know if you receive HTTP responses with status in the 4xx-5xx range as these inherently indicate some kind of problem in most cases. k6 will mark returned status codes in this range as failures unless otherwise specified. WDPs tend to do the same as well, making it easy to narrow down on problematic requests. For instance, should I fail to correlate a couple of key tokens used on the web form during the POST to checkout, I receive a couple of HTTP 403 Forbidden responses, with the selected one returning a -1 when instead I'm expecting to see a success message:
Of course, what you see here will be entirely dependent on the application you are testing.
As web developers have full control over what kind of status codes to send back to the client, you may find that sometimes an error message will be hidden within what might look like an otherwise "OK" response, i.e. those that typically return HTTP 200 OK. A classic example would be an "item out of stock" message when dealing with an eCommerce site: this is a legitimate scenario, and so sending back an error status code might not be appropriate. Still, if your script isn't finding in stock items to check out, you may find you receive actual errors later on when you try to checkout an empty cart! It's a good idea to add checks to your script to verify that you're getting the pages you expect, usually by looking for text in the response body, but WDPs can help you catch these issues during debugging as well.
Conclusion
A Web Debugging Proxy can be an invaluable tool when debugging your performance tests. Although a lot of debugging can be done using console.log statements dispersed throughout a script, sometimes it is simply easier and faster to look at HTTP requests and responses in a UI designed to display such content. Seeing what is actually transferred "over the wire" can yield insight into problems that might not otherwise be immediately obvious without sifting through lots of responses. Comparing a script replay with an equivalent recording taken with a browser (or tools such as Postman - yes you can proxy that, too!) can yield valuable insight that will help you put together a working script faster.


