If you want to jump straight to installing the marketplace extension, you can find it here.
📖What you will learn
- How to integrate load testing with k6 and Azure Pipelines
- Different implementation paths, and when to use each
Introduction
Performance issues can quickly turn expensive. Reasons can vary from unexpected traffic surges, pieces of non-performant code acting as bottlenecks, or misconfigured network components. Integrating load- and performance testing into your CI pipeline will allow you to know about performance degradations early, in most cases, even before it has any impact on your users in the production environment.
In this guide, we will be using k6 and Azure Pipelines to quickly, and effortlessly, get started.
k6 is a free and open-source testing tool for load and performance testing of APIs, microservices, and websites. It provides users with an easy-to-use javascript interface for writing load- and performance tests as code, effectively allowing developers to fit it into their everyday workflow and toolchain without the hassle of point-and-click GUIs.
Azure Pipelines is a continuous integration (CI) and continuous delivery (CD) service part of Microsoft's Azure DevOps offering. It can be used to continuously test and build your source code, as well as deploying it to any target you specify. Just as k6, it is configured through code and markup.
Writing your first performance test
It is usually a good idea to resist the urge to design for the end-goal right away. Instead, start small by picking an isolated but high-value part of the system under test, and once you got the hang of it - iterate and expand. Our test will consist of three parts:
- An HTTP request against the endpoint we want to test.
- A couple of load stages that will control the duration and amount of virtual users.
- A performance goal, or service level objective, expressed as a threshold.
Creating the test script
During execution, each virtual user will loop over whatever function we export as our default as many times as possible until the duration is up. This won't be an issue right now, as we've yet to configure our load, but to avoid flooding the system under test later, we'll add a sleep to make it wait for a second before continuing.
Configuring the load
In this guide, we will create a k6 test that will simulate a progressive ramp-up from 0 to 15 virtual users (VUs) for duration of ten seconds. Then the 15 virtual users will remain at 15 VUs 20 seconds, and finally, it will ramp down over a duration of 10 seconds to 0 virtual users.
With that, our test should now average somewhere around ten requests per second. As the endpoint we're testing is using SSL, each request will also be preceded by an options request, making the total average displayed by k6 around 20 per second.
Expressing our performance goal
A core prerequisite to excel in performance testing is to define clear, measurable, service level objectives (SLOs) to compare against. SLOs are a vital aspect of ensuring the reliability of your system under test.
As these SLOs often, either individually or as a group, make up a service level agreement with your customer, it's critical to make sure you fulfill the agreement or risk having to pay expensive penalties.
Thresholds allow you to define clear criteria of what is considered a test success or failure. Let’s add a threshold to our options object:
In this case, the 95th percentile response time must be below 250 ms. If the response time is higher, the test will fail. Failing a threshold will lead to a non-zero exit code, which in turn will let our CI tool know that the step has failed and that the build requires further attention.
ℹ️ Threshold flexibility
Thresholds are extremely versatile, and you can set them to evaluate just about any numeric aggregation of the response time returned. The most common are maximum or 95th/99th percentile metrics. For additional details, check out our documentation on Thresholds.
Before proceeding, let's add the script file to git and commit the changes to your repository. If you have k6 installed on your local machine, you could run your test locally in your terminal using the command: k6 run loadtest.js.
Running your test in Azure Pipelines
To be able to use the marketplace extension in our pipeline, we first need to install it in our Azure DevOps organization. This can be done directly from the marketplace listing. Once that is done, we're all set for creating our pipelines configuration.
⚠️ Permission to install marketplace extensions required
The recommended approach is to use the marketplace extension, but if you for some reason can't, for instance if you lack the ability to install extensions, using the docker image as described further down, works great as well.
Local Execution
We will run our tests on a virtual machine running the latest available version of Ubuntu. To run our actual load test, only one step is required.
The task for this step will be running the just installed k6-load-test extension. Additionally, we're supplying it with the filename of our test script. This will be the equivalent of executing k6 run YOUR_K6_TEST_SCRIPT.js on the pipeline virtual machine.
If your test is named test.js and is placed in the project root, the inputs key may be skipped altogether.
Do not forget to add azure-pipelines.yml and commit the changes to your repository. After pushing your code, head over to the Azure dashboard and visit the job that triggered the git push. Below is the succeeded job:
Cloud Execution
Cloud execution can be useful in these common cases:
- You want to run a test from one or multiple geographic locations (load zones).
- You want to run a test with a high-load that will need more compute resources than provisioned by the CI server.
- Get automatic analysis of the results.
Running your tests in our cloud is transparent for the user, as no changes are needed in your scripts. Just add cloud: true to your pipeline configuration.
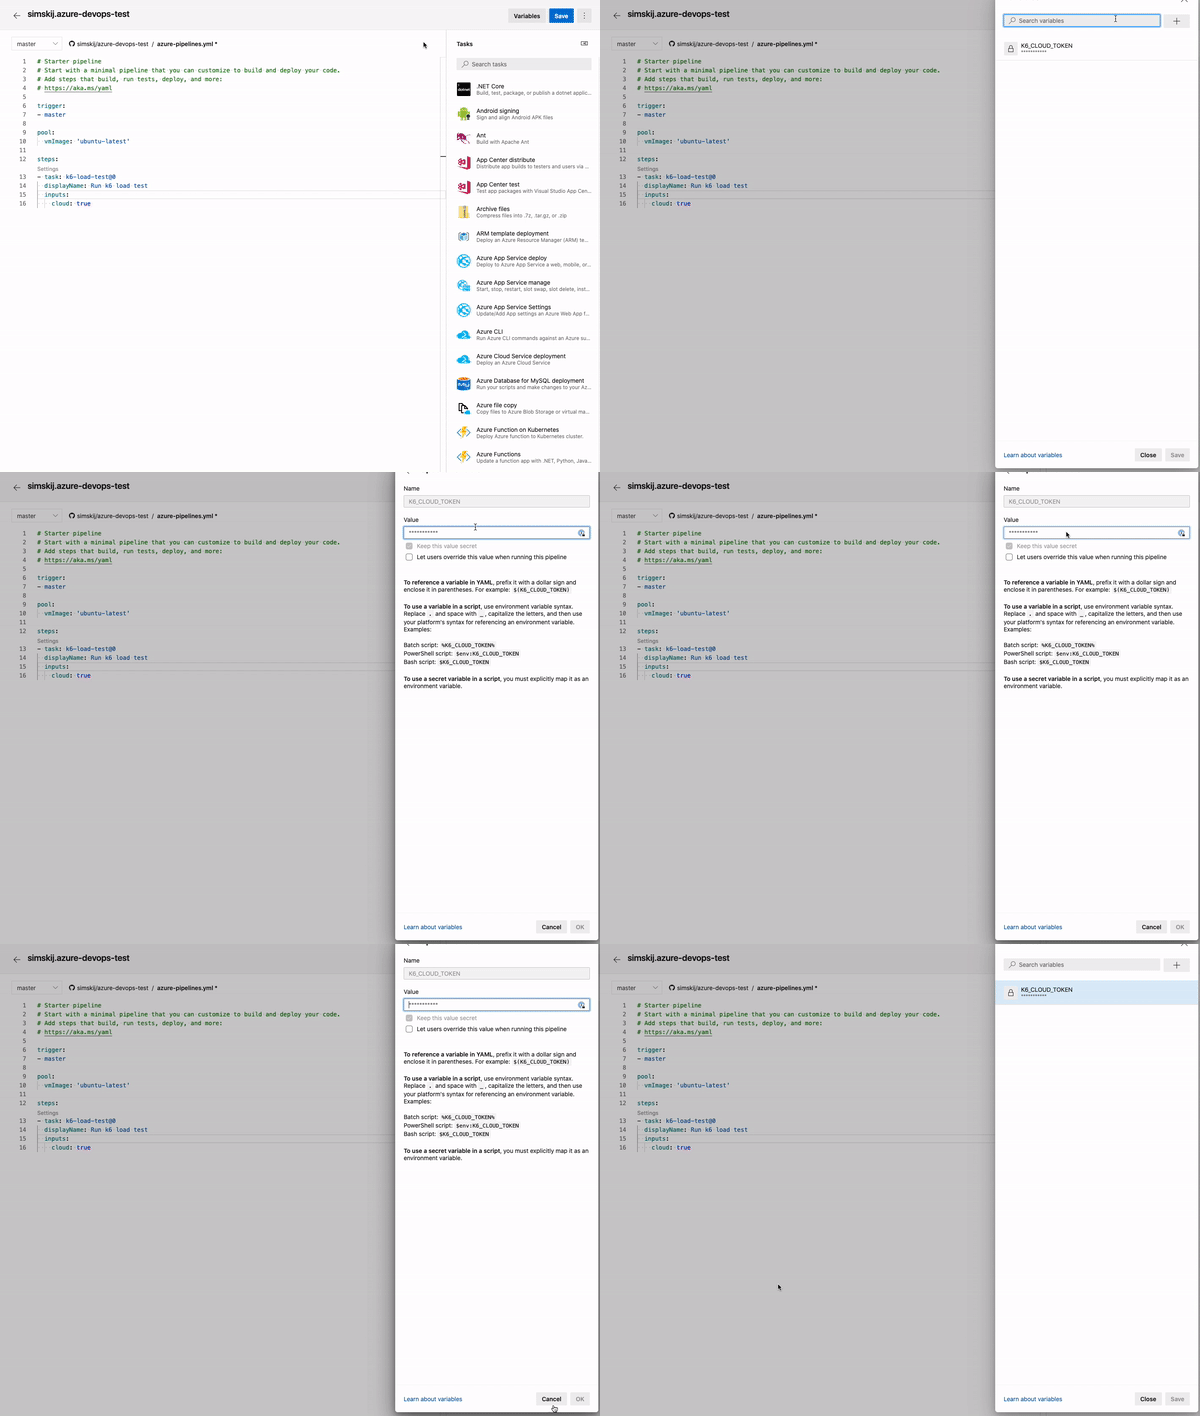
To make this script work, you need to get your account token from Grafana Cloud k6 and add it as a variable. The Azure Pipeline command will pass your account token to the Docker instance as the K6_CLOUD_TOKEN environment variable, and k6 will read it to authenticate you to Grafana Cloud k6 automatically.

By default, the cloud service will run the test from N. Virginia (Ashburn). But, we will add some extra code to our previous script to select another load zone:
This will create 100% of the virtual users in Ireland. If you want to know more about the different Load Zones options, read more here.
Now, we recommend you to test how to trigger a cloud test from your machine. Execute the following command in the terminal:
With that done, we can now go ahead and git add, git commit and git push the changes we have made in the code and initiate the CI job.
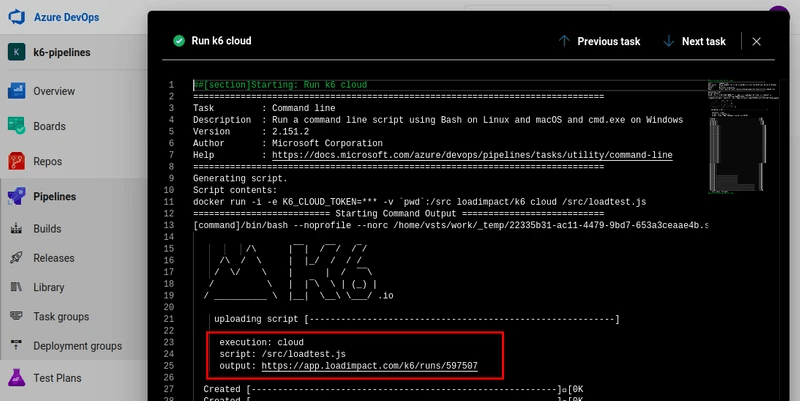
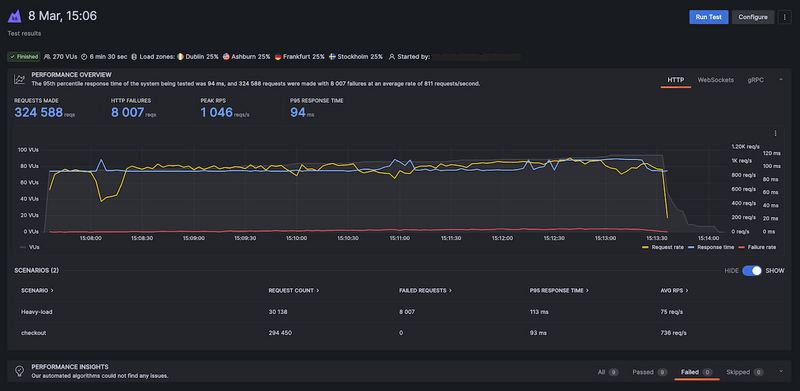
By default, the Azure Pipelines task will print the URL to the test result in Grafana Cloud k6, which you may use to navigate directly to the results view and perform any manual analysis needed.
We recommend that you define your performance thresholds in the k6 tests in a previous step. If you have configured your thresholds properly and your test passes, there should be nothing to worry about.
If the test fails, you will want to visit the test result on the cloud service to find its cause.
Variations
Scheduled runs (nightlies)
It is common to run some load tests during the night when users do not access the system under test. For example, to isolate larger tests from other types of testing or to periodically generate a performance report.
Below is the first example configuring a scheduled trigger that runs at midnight (UTC) of everyday, but only if the code has changed on master since the last run.
Using the official docker image
If you, for any reason, don't want to use the marketplace extension, you may almost as easily use the official docker image instead.
Additional resources
k6 load testing extension on the Azure DevOps Marketplace.
Summary
Integrating k6 in Azure Pipelines is done in a matter of minutes. By integrating performance testing into your CI/CD process, you'll be able to identify and correct performance regressions and keep fulfilling your SLO or SLA requirements.
If you are a Microsoft user looking for an alternative to their deprecated load testing service, we suggest that you look at our article presenting k6 as an alternative to Visual Studio Load Tests.


