We’ve gotten a lot of feedback on Insights since we launched v4.0 of the product in June 2018. We took it to heart and started iterating, improving Insights over the last couple of months. Today we’ve released a significant UX and UI refactor so a blog post to explain what’s changed is warranted.
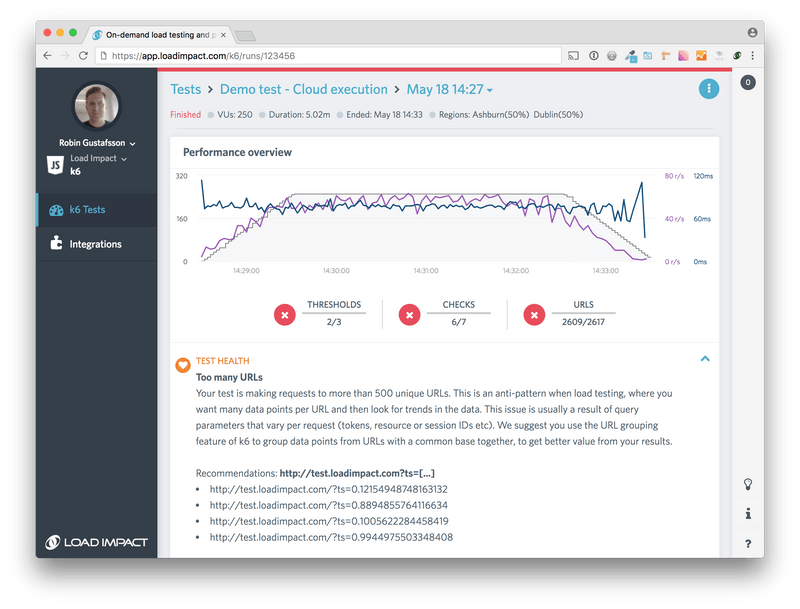
Since this post compares the new to the old, a screenshot from that first public release of Insights is appropriate:
We’ll go through each major change below but here’s a quick rundown on what’s changed since the public launch in June last year:
- Machine-assisted analysis ("Performance Alerts") is now in focus
- We broke up the "Breakdown” tab and introduced separate tabs for all the information we had crammed into the "Breakdown” tab.
- New "Thresholds” tab
- New "Checks” tab
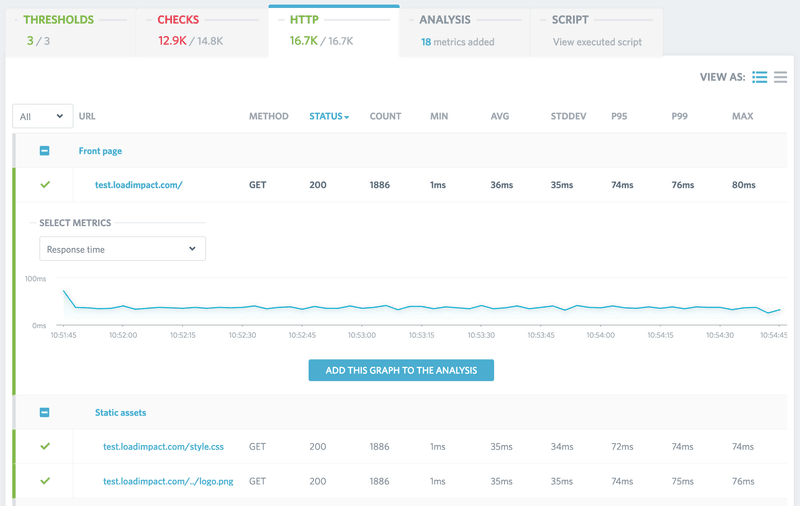
- New "HTTP” tab (old "URL table” tab)
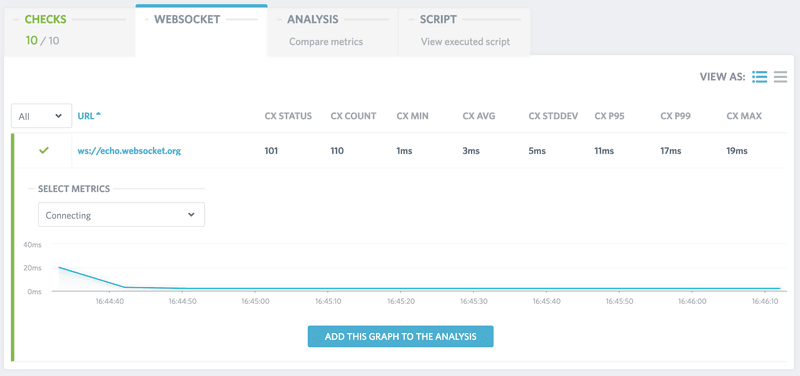
- New "WebSocket” tab
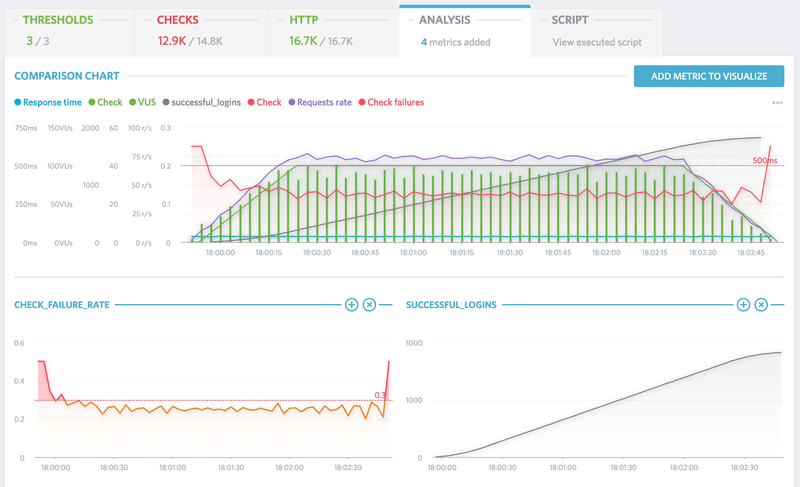
- New "Analysis” tab (old "Metrics” tab)
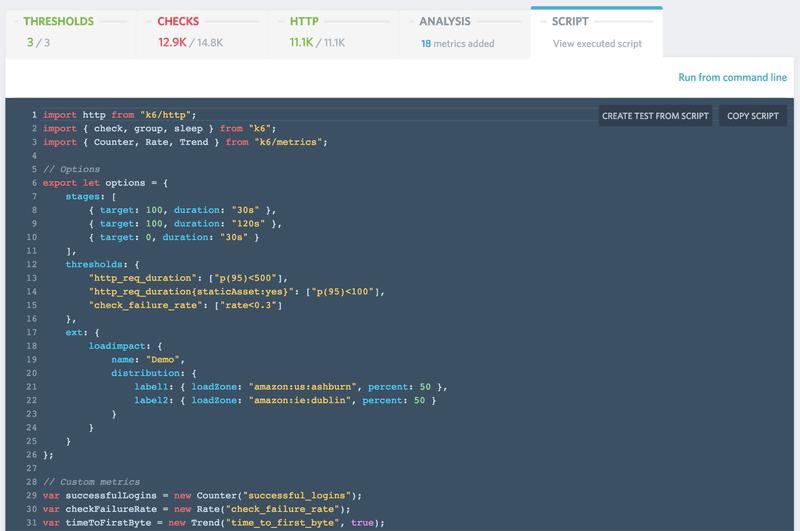
- New "Script” tab (old "Test script” tab)
Our focus is to make result analysis a quick affair. It should be obvious from a quick look at a test result whether it’s good or bad, passed or failed. If a test has failed, it should be apparent where to look in the data for more details.
Machine-assisted analysis in focus
We believe you shouldn’t need to be a performance testing expert to use our product, we thus strive to build automation into the product where it makes sense. Analysis of test results is one such area. The basics of result interpretation are the same for all performance tests, so a natural fit for automation.
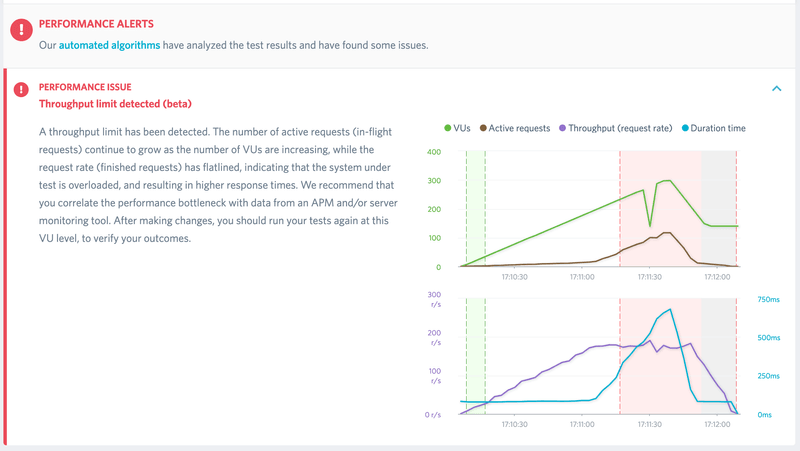
There are two different types of automation we apply, the simple type which just surfaces straightforward things like high failure rates, overloaded load generators and URLs with too much variability. Then there is the more difficult "smart” type of automation that looks at many different metrics at the same time, figuring out whether the target system has reached its concurrency limit or not.
Conceptually, the "smart” type of automation is straightforward, but in practice, there’s a lot of variability in the data and corner-cases that needs to be considered. We’ve spent several months developing, testing and refining our algorithms so that they can tell you if the target system of a test successfully coped with the traffic or not, whether its concurrency limit reached or not:
Success!
Failure.
This section of the result page is now always visible from test start to finish.
Breaking up the breakdown
The "Breakdown tree” tab in Insights is a reflection of the structure of a k6 script, and an intuitive way to read the results when analyzing. Or so we thought, but after plenty of feedback and analysis, we realized we had crammed too much information into too little screen real estate.
We needed to break up the breakdown :)
The result is 5 new tabs, replacing the "Breakdown tree” tab while retaining and moving what we’ve deemed the "good parts” to the new tabs.
You’ll notice that when we display charts in the various tabs there’s an "Add this graph to the analysis” button. This is to simplify the process of moving different metrics to the "Analysis” tab for comparison and correlation.
Thresholds tab
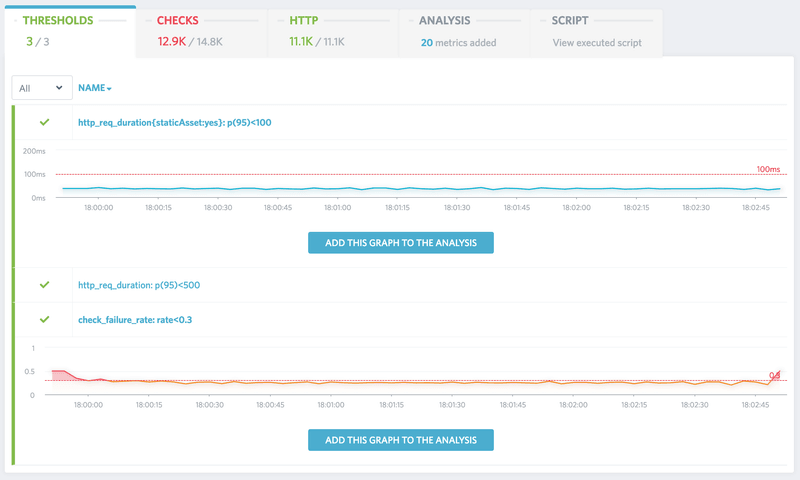
The first new tab is focused on thresholds. Thresholds are the mechanism by which test runs are passed or failed and thus vital to automation of performance tests. Having them in their own tab makes it possible for us to more clearly highlight their importance, not the least to new users of the product that haven’t discovered thresholds yet.
Make sure you follow the getting started methodology and run baseline tests before running larger tests. Then use the response times from a successful baseline test to set up thresholds for further testing.
Checks tab
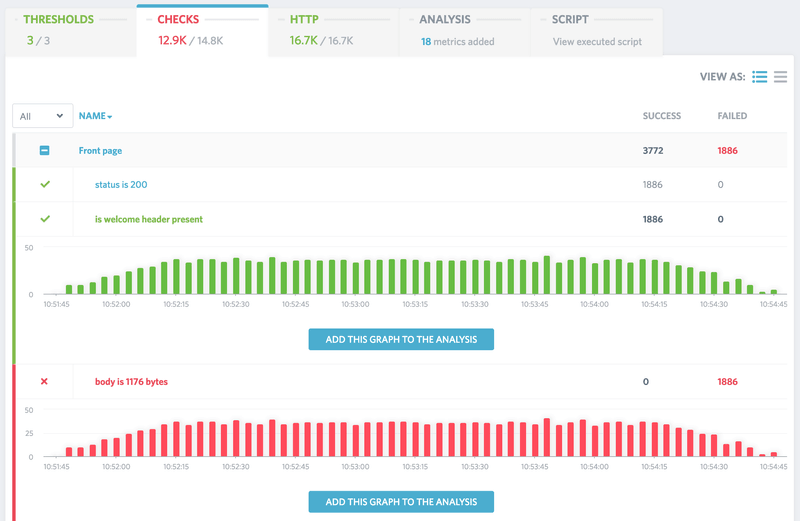
Checks are like asserts but don’t halt execution like an assert would in a unit/functional/integration test suite. Instead, it records the boolean result of the check expression for summary presentation at the end of a test run and for setting up thresholds.
Load tests are non-functional tests, but this exposes the dual nature of k6. It can both be used for load tests as well as functional tests and monitoring, and checks are equally useful for load testing as it is in the other cases.
Use checks to make sure response content is as expected, and then use it in combination with a check failure rate threshold to set pass/fail criteria.
HTTP tab
The "URL table” is now the "HTTP” tab, merged with the graphing parts from the "Breakdown tree”. Like the "Checks” tab, the table with data can be viewed as a plain list or grouped according to the group() hierarchy of the test script.
To make result interpretation easier, avoid generating too many unique URLs by using URL grouping where appropriate to view/visualize the samples from several URLs as one logical URL.
WebSocket tab
We’ve broken out the protocol specific metrics into their own tabs. WebSocket metrics, like HTTP, now have their own tab, visualizing connection oriented response times and sent and received messages.
As raw WebSocket connections don’t have a concept of request/response, path, method, response status etc. we can’t provide the same type of per-message metrics and data (nor machine-assisted analysis) that we can for HTTP out of the box. To get a similar level of detail of the data you can use custom metrics to record metrics for the different "events” or "message types” that makes sense to your application.
Analysis tab
The "Metrics” tab is now the "Analysis” tab, and it’s also seen some improvements. This is the new home for custom metrics, and every custom metric will, by default, be added as a smaller chart in this tab.
Script tab
The tab with the fewest changes. The primary change that’s happened here in the last 6 months is the switch to a dark mode theme for the script, a change we made across the app in all places where we display code.
What’s next?
Glad you asked! We’re working on some additional smaller tweaks to Insights and once those are done we’re starting the implementation of test comparison. When it lands it will be a big UX improvement that also aims to help reinforce the getting started methodology.
