Organizations use load and performance testing to prevent issues from impacting customers, which is essential if they want to stay relevant in today’s digital-first world. And with the rise of cloud native technology and DevOps, software teams must shift performance testing left, towards development.
However, traditional load and performance testing tools simply haven’t kept pace, leaving developers, operations, and QA teams siloed. The result: slower release velocity, lower production quality, and decreased customer satisfaction.
With that in mind, we are excited to introduce Grafana Cloud k6, a fully managed, scalable solution for cross-functional load and performance testing. This new offering within Grafana Cloud empowers developers, operations, and QA teams to prevent system failures and consistently deliver fast and reliable applications.
Grafana Cloud k6 builds on Grafana Lab’s June 2021 acquisition of k6 by providing a unified user experience that natively integrates the world-class load and performance testing experience in Grafana Cloud.
In this post, we’ll explore how Grafana Cloud k6 can help you:
- Shift load and performance testing left to boost release confidence and velocity
- Run tests on demand and easily scale to keep up with business needs
- Reduce mean time to resolution with full-stack visibility
Shift load and performance testing left to boost release confidence and velocity
Developers are best suited to test the code they write. They build it, which means they're closest to it and have the best sense for how it should work. It's also faster and more efficient than traditional testing approaches that pull in outside parties. But legacy load testing tools are not suitable for dev teams: some use obscure domain specific languages for scripting, or they're specifically designed for dedicated QA teams testing right before release.
When developers don't participate, or when there's poor collaboration between the development and QA teams, it can cause costly release delays and unnecessary software rewrites.
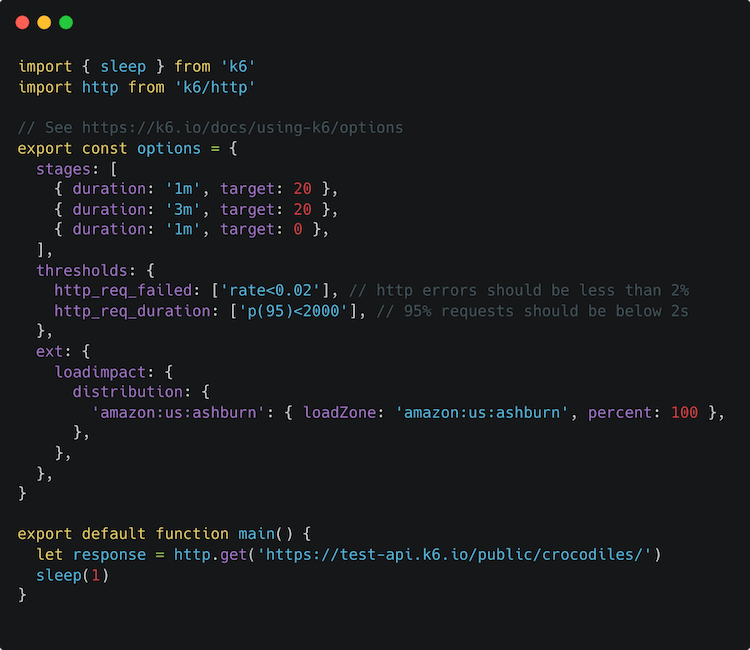
Grafana Cloud k6 provides a developer-centric, collaborative testing experience that breaks down the traditional Dev, QA, and Ops silos. The k6 API and CLI are easy-to-use, flexible, powerful, and well-documented. And k6 uses JavaScript as the scripting language, which is familiar to both developers and QA engineers.
Plus, users can easily integrate k6 with CI/CD tools such as CircleCI, GitHub Actions, GitLab, Jenkins, and Microsoft Azure Pipelines to automate tests and use SLOs as the pass/fail criteria.

Run tests on demand and easily scale to keep up with business needs
It’s one thing to run one load test from a single machine. It’s another thing to generate and orchestrate dozens of large tests concurrently from multiple geographic locations.
Server synchronization and database bottlenecks are the main challenges for a scalable load testing architecture, but many more issues can arise when implementing an architecture for running concurrent, distributed tests. Even the best-performing time-series database can struggle to store the results of a large load test.
In addition, building a home-grown solution typically means that institutional knowledge lives within a person or small team, which presents a risk for the organization. It also means the company is standing up teams solely focused on something that is not its core competency. For most organizations, load testing is another internal project with minimal functionality and additional maintenance burdens.

Because Grafana Cloud k6 offers a fully managed, scalable solution, organizations can skip the hassle of building and maintaining load testing infrastructure and focus instead on improving products. With k6, users can run globally distributed tests with up to 1 million concurrent users or 5 million requests per second across more than 20 geographic locations. This ensures a great experience wherever the end customers are. Users also have the option to run tests from their infrastructure, dedicated IPs, or private load zones for improved privacy or application security.
Though we see Grafana Cloud k6 as a major step forward for k6 and performance testing in Grafana Cloud, k6 has already proven its merit with existing users. As Anton Khabaiev, Director of Engineering at fuboTV, once said: “The reliability and availability of Grafana k6 allow us to spend our time building great features that power fuboTV products instead of worrying about potential performance regression issues.” With this deeper integration, we're excited to see what else our users can do in this space.
Reduce mean time to resolution with full-stack visibility
After a load or performance test, users need to interpret the results and spot problems quickly. Traditional load testing solutions are considered “black box testing,” providing high-level performance metrics such as response time, traffic, and error rate. These metrics may surface a performance issue, but users still need to look inside the application and infrastructure to find the root cause.
Teams therefore have to pivot between multiple monitoring and testing tools, leading to increased MTTR. It’s not surprising then that 27% of teams said their biggest challenge in maximizing the value of their testing was a lack of information needed to identify the root cause, and 22% said slow processes around defect resolution were holding them back, according to a recent survey.
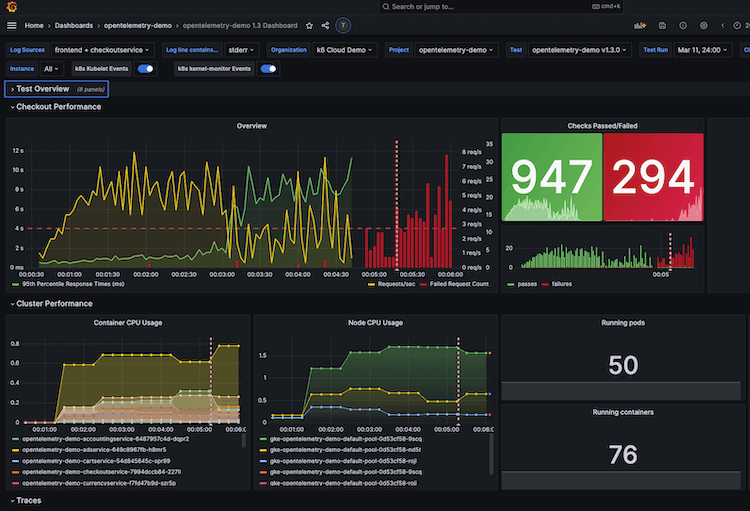
Grafana Cloud k6 provides out-of-box, real-time visualization as the test runs, with its intelligent Performance Insights algorithms automatically surfacing test and application performance related issues. Moreover, because Grafana Cloud k6 is fully integrated into Grafana Cloud, users can easily visualize and query k6 tests in Grafana dashboards and correlate k6 test results with server-side metrics, traces, and logs to find root causes quickly — without ever switching platforms.

The time to shift from reactive to proactive is now
Grafana Cloud k6 is generally available today for all Grafana Cloud customers who are not existing k6 Cloud customers. Existing k6 Cloud customers will not be impacted — they will be migrated to the new experience at a later date. You can check out our documentation and website for more information about the product.
Existing Grafana Cloud Free customers already have 500 virtual user hours per month included in their plans. For Grafana Cloud Pro customers, that number jumps to 1,000. Simply go and look for the Grafana Cloud k6 icon in the vertical sidebar and start testing!
And for existing Grafana Cloud Advanced customers: k6 is included by default in all Flexible Spend Commits. Contact your customer success managers for custom pricing.
Not a Grafana Cloud user yet? You can sign up for a free account that includes 500 free virtual user hours (VUh) per month or contact us here.