📖What you will learn
- How to monitor the resouce utilization of your application using Datadog
- How to create a monitor in Datadog to automatically alert whenever a threshold is passed
- How to set up thresholds in k6 to automatically pass or fail your tests
Introduction
Datadog is a monitoring and analytics platform that can help you to get full visibility of the performance of your applications. Here at LoadImpact we use Datadog to monitor various different services of our platform. Datadog alerts give the ability to know when critical changes in your system are occurring. These triggered alerts appear in Datadog's Event Stream, allowing collaboration around active issues in your applications or infrastructure.
One potential performance issue is that a System Under Test(SUT) has high CPU consumption when under stress. This tutorial will show you how to fail your load test for this type of condition by using Datadog's API and thresholds in LoadImpact.
Requirements
- A site/system to test. In this example, we will test a site already running as a ECS Service. This site is available at https://httpbin.test.loadimpact.com.
- An already configured Datadog integration with a platform your site is running on. In our case it is Datadog integration with AWS, please refer to the official Datadog AWS Integration Guide for details.
- k6 v0.25.0 (or above) is installed. If you do not have this installed, please refer to the official k6 installation page. You can verify your current k6 version by command k6 version.
- An account in Datadog that allows us to create monitors.
Creating a Monitor in Datadog
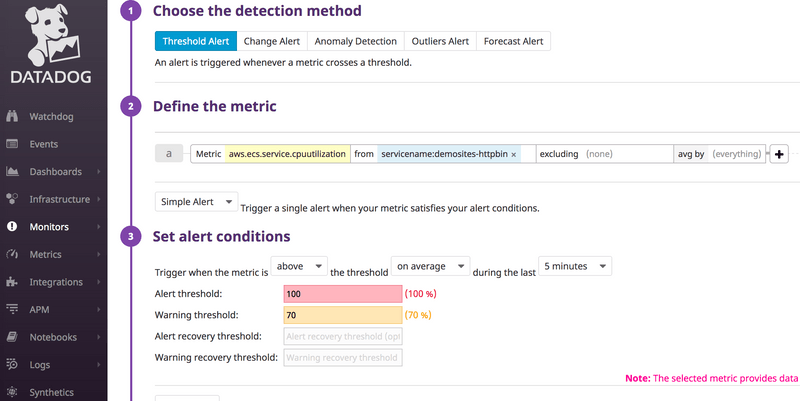
First, we want to create a monitor in Datadog which triggers an alert if CPU utilization reaches 100 units or more on the ECS Service. You may wish to monitor something else, so feel free to adjust this to meet your needs. While creating a monitor make next actions:
- Choose Threshold alert as a detection method
- Choose aws.ecs.service.cpuutilization metric from servicename:<your_service_name> in "Define the metric" step
- Configure "Alert threshold" to be 100
- Edit message and notification steps and save Monitor
Now the monitor will appear in the Datadog Event Stream if the metric threshold is reached. This is what we will look for when we evaluate the LoadImpact Thresholds later.
Writing a performance test
Next, we will need a test script to run. Here is our example that we will use in this test:
You can find how to manage your Datadog API and Application keys here.
Running a k6 test
If you have installed k6 in your local machine, you could run your test locally in your terminal using the command: k6 run performance-test.js
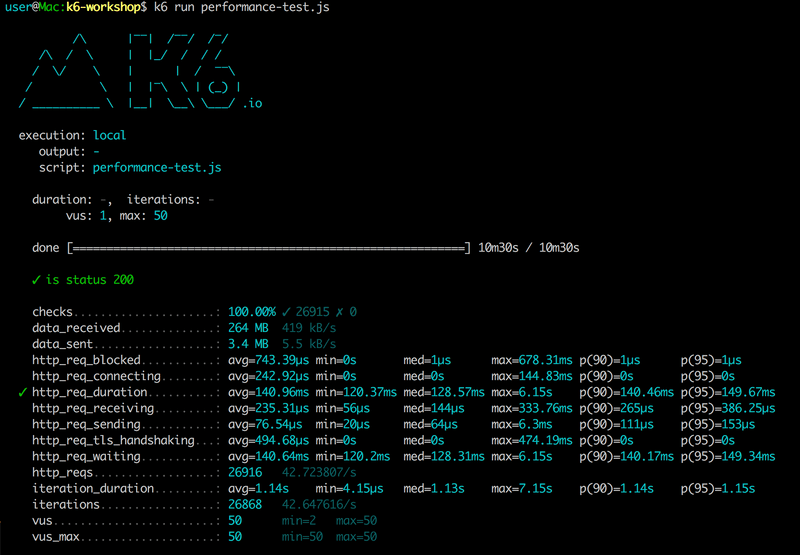
Run your test and in our case since we configured our script to run only 50 VUs, that load will be not enough to trigger a CPU alert, therefore 1st run will be passed:
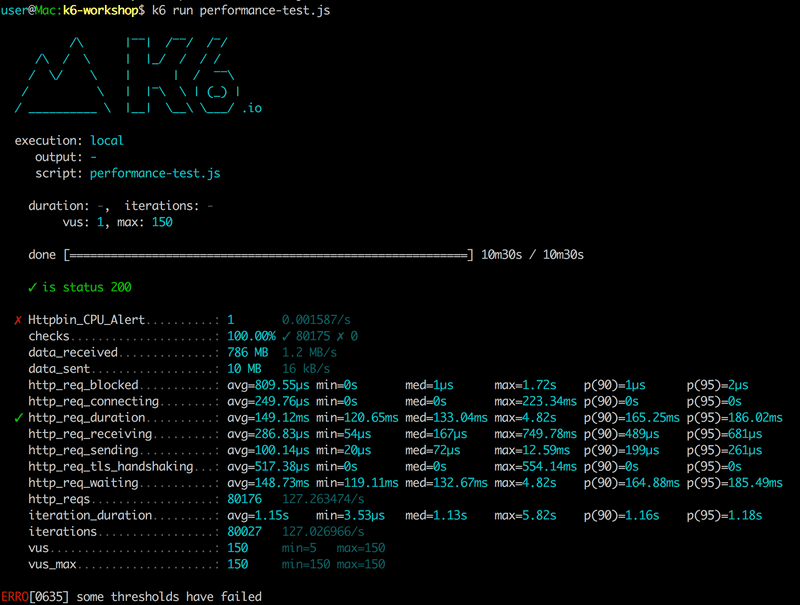
Let's update our script to produce more load on our system under test. For this example, we achieve this by increasing number of VUs from 50 to 150:
As we can see, after increasing load our test was failed due to exceeding our defined threshold value:


