Version 3.0 of Load Impact is live!
This version features a completely redesigned UI as well as lots of cool features that are already implemented in the backend, which we will be rolling out steadily over the course of the next few weeks.
While the new design is certainly more attractive and modern, we’re most proud of the substance and rationale behind the update.
To give you some background and context for this update, let us explain why UI/UX was priority for this version.
When we first set out to build Load Impact, we were a team of mostly hard-core backend developers. We knew we wanted to simplify the execution of load testing by making it more accessible over the cloud and offering quick load ramp-up with the click of a button (i.e. you can enter a URL, click "start test” and ramp-up from 1 to over 100,000 concurrent users in under a minute).
So, although we are constantly working on improving the robustness and functionality of our tool, we decided it was time to make our tool even easier to use by improving the user interface and experience with more intuitive and aesthetically pleasing design. Not to mention making it easier for those using touch screens.
We also wanted to make a tool for the modern performance tester, who we believe is interested in continuous integration and automated testing. All of which will be a big focus for us in the near term.
Load Impact 3.0 is ready for teams embracing DevOps and continuous delivery, but we know there is much more to do!
Here are just a few of the things we’ll be rolling out in the coming months:
So….for those of you who have been enjoying Load Impact so far, here are some changes we believe you will appreciate:
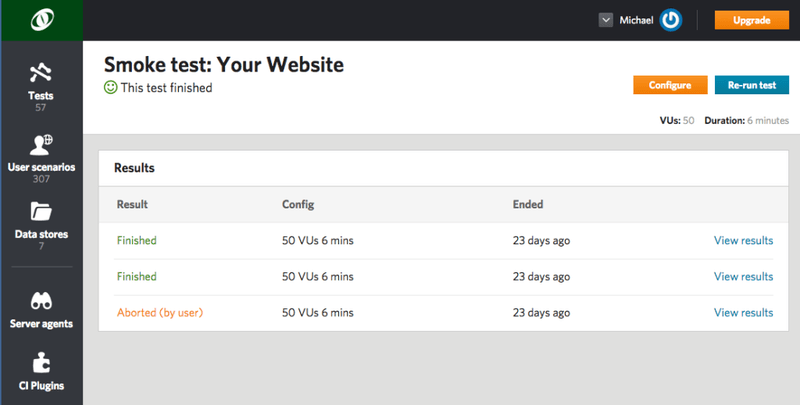
Test configurations and results:
Instead of one big list of test runs and one big list of test configurations, we’ve grouped all test results under their respective configurations. This way you can see all runs of the same test config listed together.
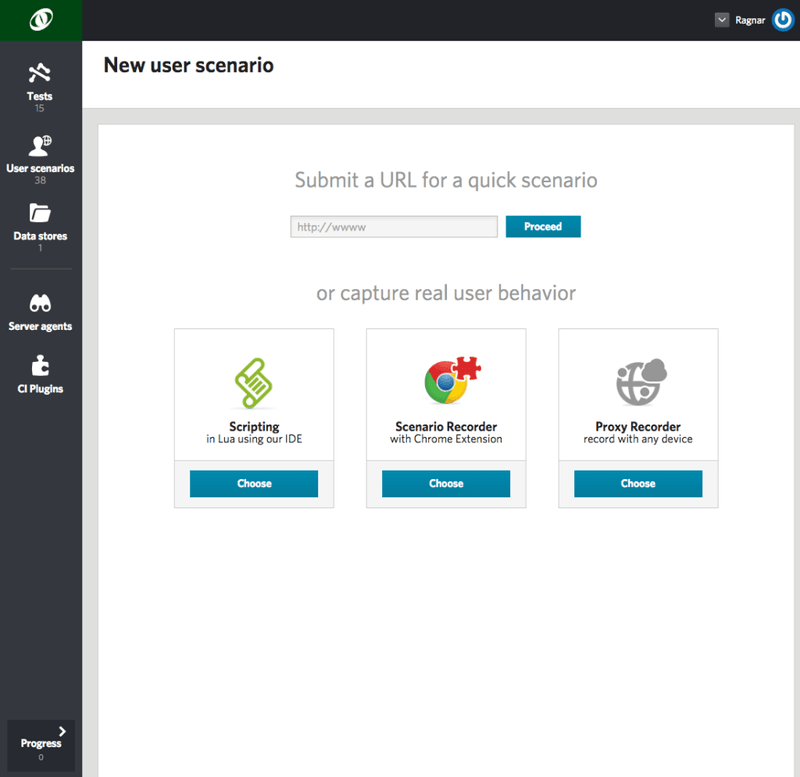
User scenario recording and scripting
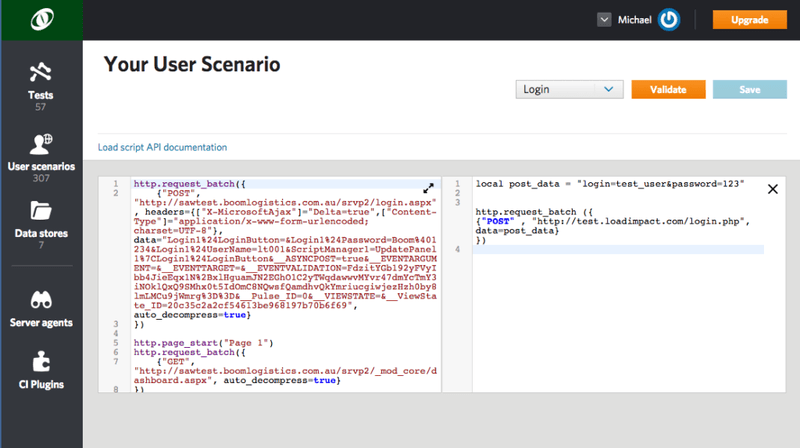
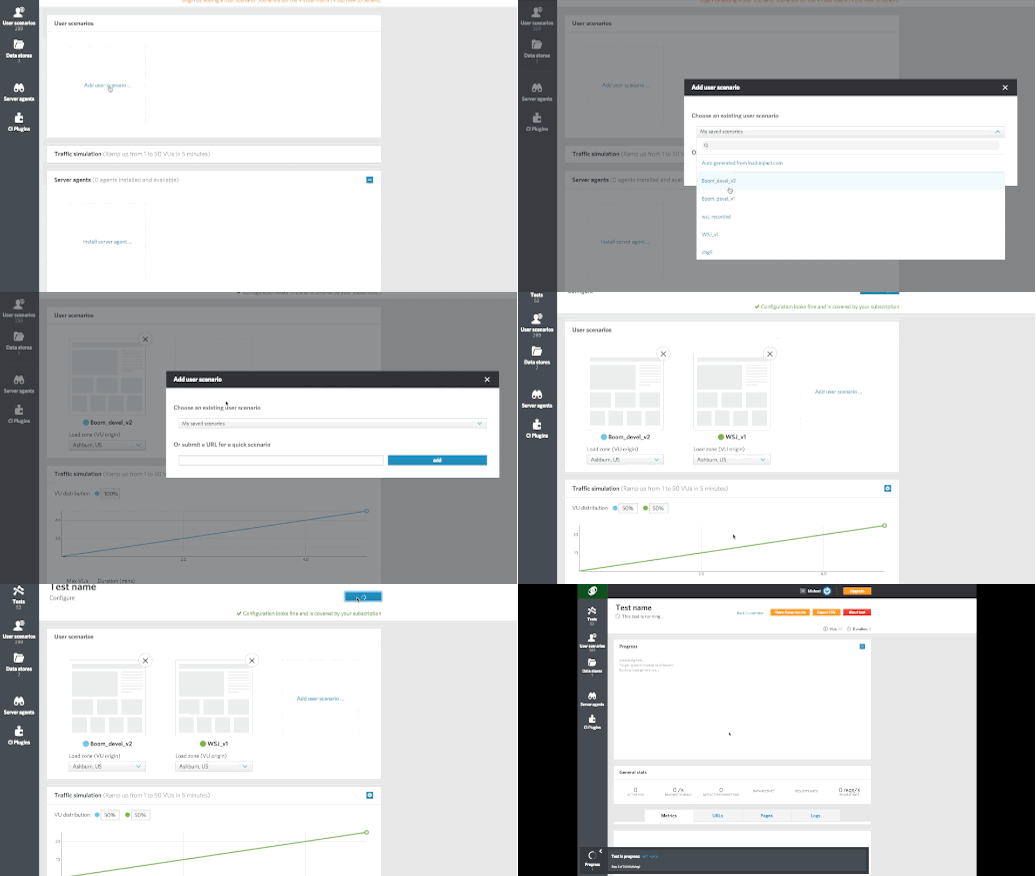
All your scenarios — whether they were recorded, scripted in our IDE or auto-generated — will be listed together under "User scenarios” in the left bar menu. The best thing about this particular update is that you can auto-generate a quick scenario by entering a URL and then go and edit that auto-generated script directly in our IDE. You no longer have to create an advanced script from scratch. Instead, allow us to help get you started.
As you can see below, when you want to edit or write a script, you can quickly view our suggested code examples side-by-side with your script. And we'll be adding more code examples every day!
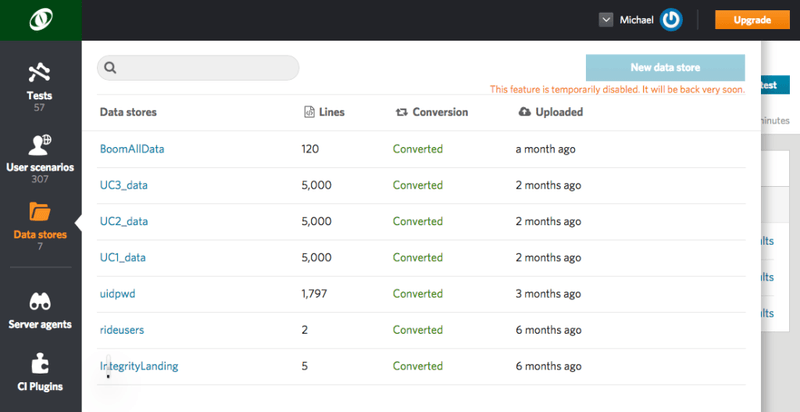
Data Stores:
Quick access to the data used in your scripts.
Note: This feature will be temporarily deactivated for new data stores while some finishing touches are put on. It be live again very soon.
For those of you with existing data stores saved: No need to worry, those will be available for use right away.
Server Agents:
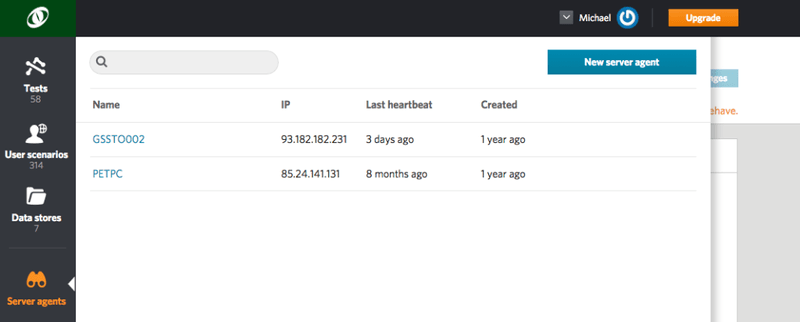
A simple list of all your server agents will be listed by the date they were created and when the last heartbeat was.
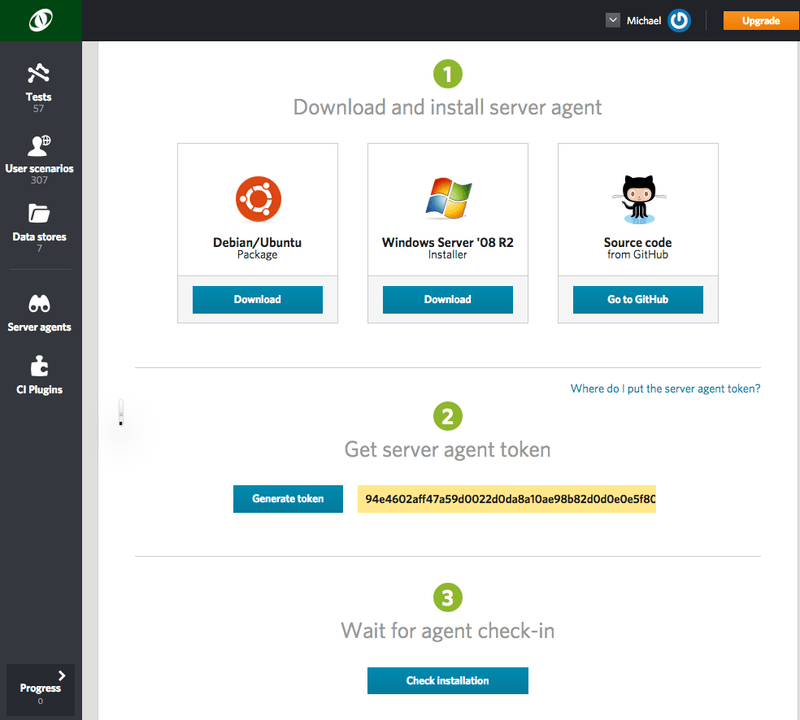
Also, install and check-in new agents in three simple steps.
Results view and metrics:
The updates in this category are a mix of new metrics and new ways of seeing old metrics.
First, the new metrics:
- Delta bytes received:
Shows the number of bytes received in the most recent sample interval. This metric is very similar to the "Bandwidth" metric, although it doesn't represent a one-second time period. - Delta requests:
Shows the number of HTTP requests made in the most recent sample interval. This metric is very similar to "Requests/second," although it doesn't represent a one-second time period. - Progress percent total:
Shows the load test progress, i.e. how far the load test has come. For example, a 5-minute test would log "Progress percent total" = 80 after it has been running 4 minutes. - Total bytes received:
The total number of bytes received during the test. - Total requests:
The total number of HTTP requests made during the test.
Now, the old ones visualized in new ways:
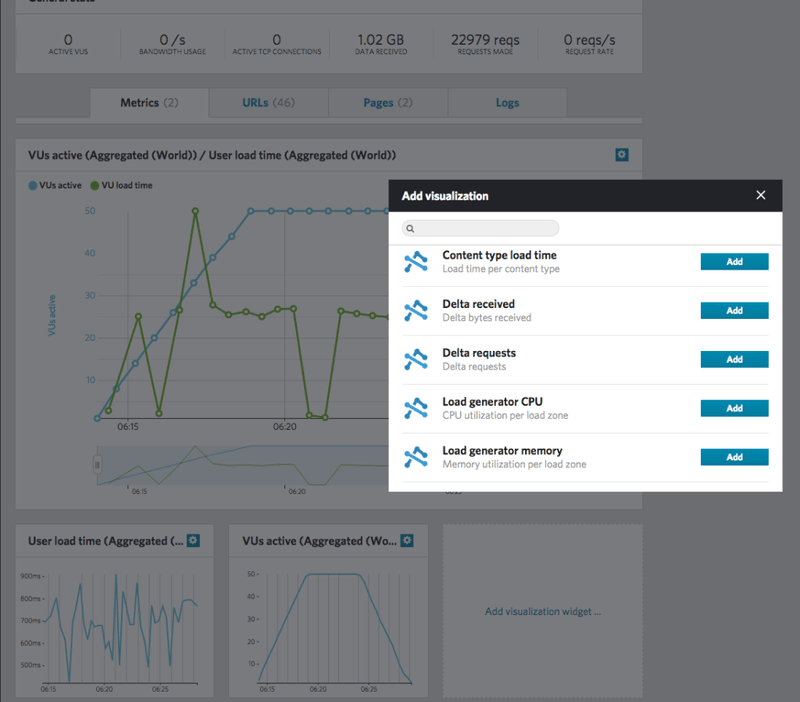
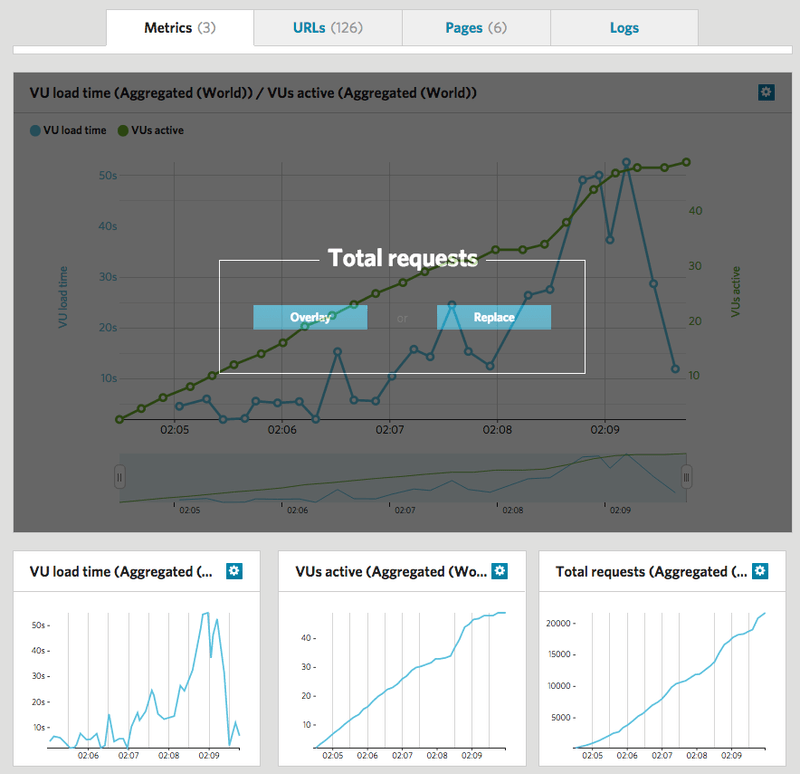
As you can see from the screenshot below, we’ve made visualizing different metrics even easier. Just click a new "visualization widget” and select which metrics you would like to see. Then, simply drag and drop it into the larger graph area to either replace the graph that’s there or overlay the results.
Pricing
Finally, we've also made some updates to our pricing. For the same price, some of our plans now include a higher level of VUs, some have a longer test duration and all plans now include 1 or 2 Max Capacity tests per month - allowing you to burst past the default VU level of your subscription and really stress your systems.
We've also added a new lower level plan: for \$89 a month you can run 15 tests up to 500 VUs (120 min test duration) and 1 test up to 1000 VUs (only available on a quarterly basis).
Moreover, we offer a 25% discount if you choose to subscribe to any plan on a quarterly basis.
Review detailed plans
There were also a few terminology changes made to simplify things and provide consistency. What used to be called "User load time” is now called "VU load time;” and what used to be called "Clients active” is now called "VUs active” (VU = virtual users).
Scheduling tests will be temporarily disabled. We’re just polishing it up and will have it live again very shortly.
For those who love the live map showing where load is being generated from as a test is running (we love it too!), it will be back shortly. We're working on making the visualization of multi-geo load generation more accurate.
As always, we welcome your feedback. Your loyalty and support have made us what we are today, and we’re always happy to chat about your project and how we can give you the right tools to succeed.
Stay tuned. The best is yet to come!
