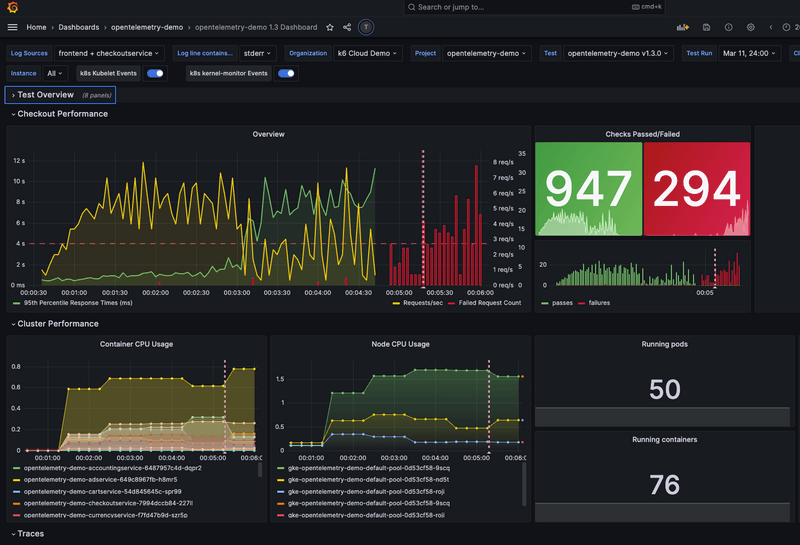
You can use Grafana to visualize your k6 metrics.
The first step is to upload your test result metrics to a storage backend. And next, configure Grafana to fetch the data from your backend to visualize the test results.
This tutorial shows how to use InfluxDB instance as a destination for k6 output and to configure Grafana to query the k6 metrics from InfluxDB.
Installing InfluxDB
Full installation instructions are available in the InfluxDB docs.
Run the test and upload the results to InfluxDB
k6 has built-in support for outputting results data directly to an InfluxDB database using the --out (-o) switch:
The above command line makes k6 connect to a local influxdb instance, and send the results from the test to a database named myk6db. If this database does not exist, k6 will create it automatically.
Once you have k6 results in your InfluxDB database, you can then use Grafana to create results visualizations.
Install Grafana
Full installation instructions are available in the Grafana docs.
After the installation, you should have an InfluxDB server running on localhost, listening on port 8086, and a Grafana server on http://localhost:3000. Now, we show two different ways to visualize your k6 metrics:
Custom Grafana dashboard
- Open http://localhost:3000 (or wherever your Grafana installation is located) in your browser.
- Create a data source:
- Now create a dashboard. Here is the newly created dashboard:
- Click Graph to create a new graph panel:
- Click the Panel title and then Edit to set up the graph panel:
- Set the panel data source to your myk6db database and click the SELECT mean(value)...
statement to edit the metric:
Preconfigured Grafana dashboards
You can find a list of Grafana dashboard configurations contributed by users, specifically for use with k6, at grafana.com.
To enable a contributed Grafana dashboard is simple: you just choose to "import" a dashboard in the Grafana UI and then specify the ID number of the dashboard you want, see http://docs.grafana.org/reference/export_import for more details.
Using our docker-compose setup
To make all the above even simpler, we have created a docker-compose setup that will:
- Start a Docker container with InfluxDB
- Start a Docker container with Grafana
- Make available a k6 container that you can use to run load tests
Make sure you have at least docker-compose version v1.12.0 installed. You just need to do the following:
Now you should be able to connect to localhost on port 3000 with your browser and access the Grafana installation in the Docker container.
InfluxDB options
When uploading the k6 results to InfluxDB (k6 run --out influxdb=), you can configure other InfluxDB options passing these environment variables:
InfluxDB Options | Description | Default |
---|---|---|
K6_INFLUXDB_USERNAME | InfluxDB username, optional | |
K6_INFLUXDB_PASSWORD | InfluxDB user password | |
K6_INFLUXDB_INSECURE | If true, it will skip https certificate verification | false |
K6_INFLUXDB_TAGS_AS_FIELDS | A comma-separated string to set k6 metrics as non-indexable fields (instead of tags). An optional type can be specified using :type as in vu:int will make the field integer. The possible field types are int, bool, float and string, which is the default. Example: vu:int,iter:int,url:string,event_time:int | |
K6_INFLUXDB_PUSH_INTERVAL | The flush's frequency of the k6 metrics. | 1s |
K6_INFLUXDB_CONCURRENT_WRITES | Number of concurrent requests for flushing data. It is useful to not block the process when a request takes more than the expected time (more than push interval). | 4 |