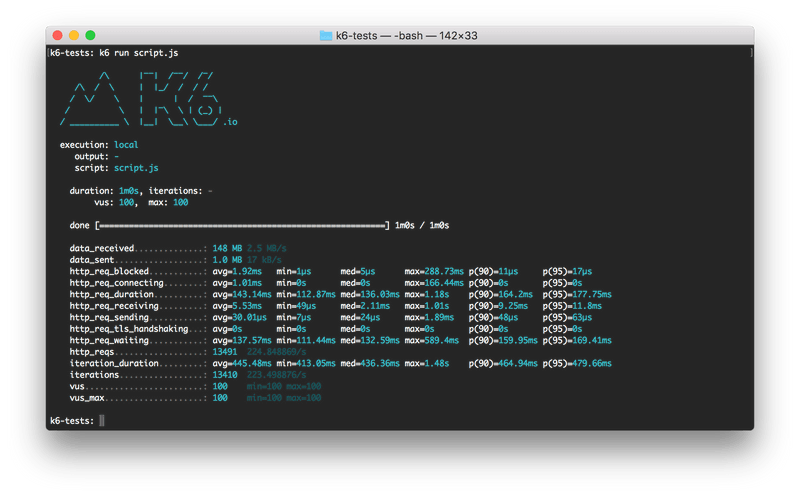
As k6 generates load for your test, it also makes metrics that measure the performance of the system. Broadly, you can analyze metrics in two ways:
- As summary statistics, in an end-of-test summary report.
- In granular detail, with measurements for every data point across test (and timestamps)
You can customize almost every aspect of result output:
- Create custom metrics
- Configure new summary statistics and print them to any text format.
- Stream the results to one or multiple services of your choice (for example, InfluxDB or Prometheus).
Metrics
Documentation: Using metrics
k6 comes with built-in metrics about the test load and the system response. Key metrics include:
- http_req_duration, the end-to-end time of all requests (that is, the total latency)
- http_req_failed, the total number of failed requests
- iterations, the total number of iterations
End-of-test summary
Documentation: End-of-test summary
By default, k6 prints summarized results to stdout.
When you run a test, k6 outputs a plain-text logo, your test progress, and some test details. After the test finishes, k6 prints the full details and summary statistics of the test metrics.
The end-of-test summary shows aggregated statistical values for your result metrics, including:
- Median and average values
- Minimum and maximum values
- p90, p95, and p99 values
You can configure the statistics to report with the --summary-trend-stats option. For example, this command displays only median, p95, and p99.9 values.
Custom reports with handleSummary()
For completely customized end-of-summary reports, k6 provides the handleSummary() function.
At the end of the test, k6 automatically creates an object with all aggregated statistics. The handleSummary() function can process this object into a custom report in any text format: JSON, HTML, XML, and whatever else.
Time series and external outputs
Documentation: Real-time metrics
The condensed end-of-test summary provides a top-level view of the test. For deeper analysis, you need to look at granular time-series data, which has metrics and timestamps for every point of the test.
You can access time-series metrics in two ways:
- Write them to a JSON or CSV file.
- Stream them to an external service.
In both cases, you can use the --out flag and declare your export format as the flag argument. If you want to send the metrics to multiple sources, you can use multiple flags with multiple arguments:
The available built-in outputs include:
