attentionThis feature is being deprecated. If you're using Grafana Cloud k6, we recommend using Data source plugins for Grafana to visualize and correlate your APM and k6 metrics.
With this integration, you can export test result metrics from the k6 Cloud to a Prometheus instance hosted by Grafana Cloud. After that, you can use Grafana to query, visualize, and correlate k6 metrics with all your other metrics.
⭐️ Cloud APM integrations are available on Pro and Enterprise plans, as well as the annual Team plan and Trial.
Before you start
If you don't have a Grafana Cloud account, sign up. The free plan includes 10,000 Prometheus series.
Necessary values from Grafana Cloud
To export k6 Cloud results to Grafana cloud, you need the following data from your Grafana Cloud Prometheus instance:
- URL
- Username
- Password
To access this information:
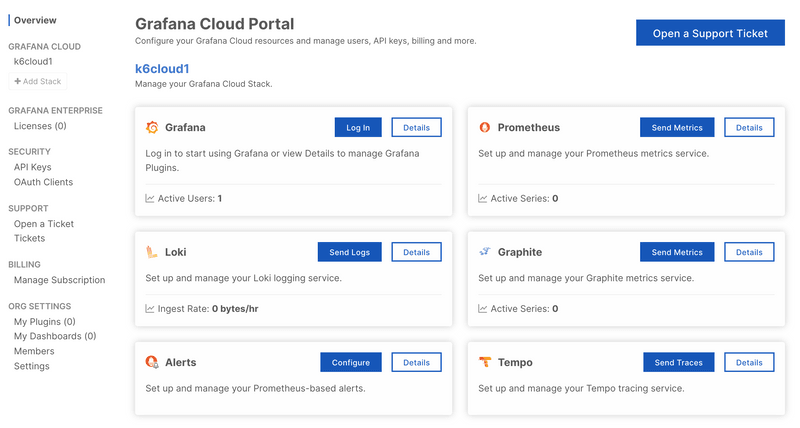
Log in to Grafana.com and visit the Cloud Portal.
Select the Details button of your Prometheus service.
Copy the URL of the Remote Write Endpoint and the Username / Instance ID.
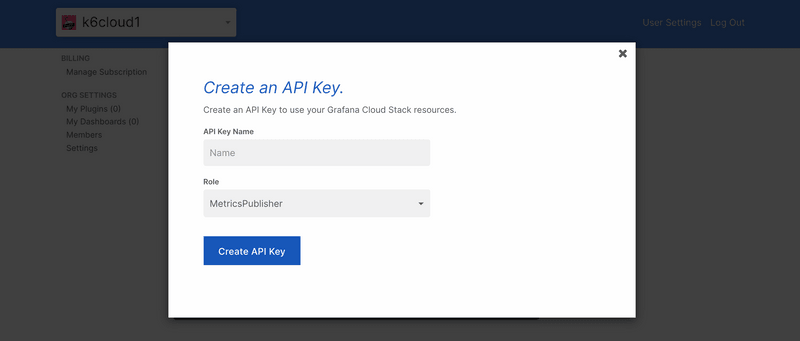
For the password, create and copy an API key of the MetricsPublisher role.
Now, you can set the URL, username, and password in k6 Cloud to authorize exporting k6 Cloud metrics to your Prometheus instance.
Export k6 Cloud results to Grafana Cloud
Now that you have the necessary values from Grafana Cloud settings, you can configure k6 Cloud tests to export.
Currently, there are two options to set up the Cloud APM settings in the test:
Configuration with the Test Builder
You have to configure the Grafana Cloud integration for an organization. From the k6 Cloud app, follow these steps.
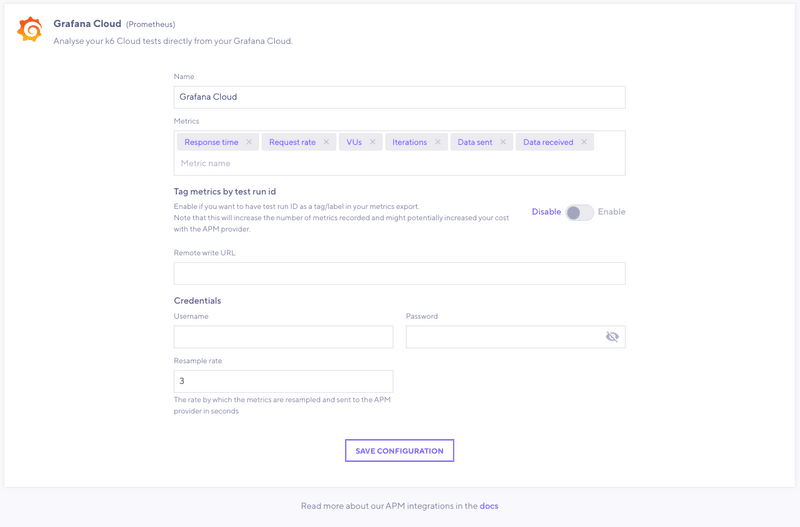
In the main navigation, go to Manage > Cloud APM, and select Grafana Cloud.
In the form, paste the URL, username, and password that you copied previously.
For details, refer to configuration parameters.
Save the Grafana Cloud configuration for the current organization.
Note that configuring the Grafana Cloud settings for an organization does not enable the integration. You must manually enable each test using the test builder.
Create a new test with the Test Builder, or select a test that was previously created with the Test Builder.
To enable the integration for the test, select the Cloud APM option on the Test–Builder sidebar.
Configuration in the k6 script
If you script your k6 tests, you can configure the Cloud APM settings using the apm option in the k6 script.
The parameters to export k6 metrics to a Grafana Cloud Prometheus instance are as follows:
Configuration parameters
| Name | Description |
|---|---|
| provider(required) | For this integration, the value must be prometheus. |
| remoteWriteURL(required) | URL of the Prometheus remote write endpoint. For example: https://prometheus-us-central1.grafana.net/api/prom/push. |
| credentials(required) | The credentials to authenticate with the Grafana Cloud Prometheus instance. The required parameters are: - username: the Prometheus username or instance ID. - password: a Grafana Cloud API key of type MetricsPublisher. |
| includeDefaultMetrics | If true, add default APM metrics to export: data_sent, data_received, http_req_duration, http_reqs, iterations, and vus. Default is true. |
| metrics | List of metrics to export. A subsequent section details how to specify metrics. |
| includeTestRunId | Whether all the exported metrics include a test_run_id tag whose value is the k6 Cloud test run id. Default is false. Be aware that enabling this setting might increase the cost of your APM provider. |
| resampleRate | Sampling period for metrics in seconds. Default is 3 and supported values are integers between 1 and 60. |
Metric configuration
Each entry in the metrics parameter can be an object with the following keys:
| Name | Description |
|---|---|
| sourceMetric(required) | Name of k6 builtin or custom metric to export, optionally with tag filters. Tag filtering follows Prometheus selector syntax, Example: http_reqs{name="http://example.com",status!="500"} |
| targetMetric | Name of resulting metric in Grafana/Prometheus. Default is the name of the source metric with the prefix k6_ Example: k6_http_reqs |
| keepTags | List of tags to preserve when exporting time series. |
keepTags can have a high cost
Most cloud platforms (including Grafana) charge clients based on the number of time series stored.
When exporting a metric, every combination of kept-tag values becomes a distinct time series in Prometheus. While this granularity can help test analysis, it will incur high costs with thousands of time series.
For example, if you add keepTags: ["name"] on http_* metrics, and your load test calls many dynamic URLs, the number of produced time series can build up very quickly. Refer to URL Grouping for how to reduce the value count for a name tag.
k6 recommends exporting only tags that are necessary and don't have many distinct values.
Read more: Time series dimensions in Grafana documentation.
Metric configuration detailed example
Run the cloud test
Once you have set up the Grafana Cloud settings in the test, you can run a cloud test as usual. k6 Cloud continuously export the test-result metrics to the Prometheus endpoint as the test runs.
To find metrics and test the integration:
Open the Grafana UI.
In the main navigation, select Explore.
Make sure to apply a time range that includes when you ran the test.
With the query builder, you can find your metrics and add them to your dashboard.
On some versions of Grafana, you may have to toggle between code and builder. Make sure you are in a valid time range, too.
You can now start using all Grafana visualization capabilities for the k6 metrics. And correlate k6 metrics with other system metrics to get better insights into what happens during your tests.


