attentionThis feature is being deprecated. If you're using Grafana Cloud k6, we recommend using Data source plugins for Grafana to visualize and correlate your APM and k6 metrics.
You can export test result metrics from the k6 Cloud to Azure Monitor, and use Azure Monitor to store and analyze all your data from your Azure and other environments.
⭐️ Cloud APM integrations are available on Pro and Enterprise plans, as well as the annual Team plan and Trial.
Export k6 metrics to Azure monitor
You must enable the Azure Monitor integration for each test whose metrics you want to export. k6 will export the metrics as the test runs.
Currently, there are two options to set up the Cloud APM settings in the test:
In both cases, you'll need to paste in some values from Azure. Instructions about where to find these values in the Azure UI are in a subsequent section.
Configure Azure export with the Test Builder
First, configure the Azure Monitor settings for an organization.
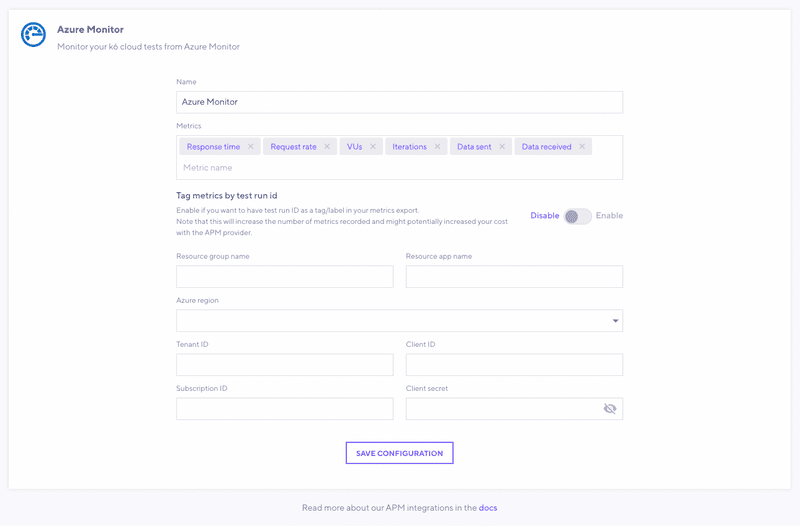
From the Main navigation, go to Manage > Cloud APM and select Azure Monitor.
In this form, copy over the parameters from Azure.
For more information on the other input fields, refer to the configuration parameters.
Save the Azure Monitor configuration for the current organization.
Note that configuring the Azure Monitor settings for an organization does not enable the integration. You must manually enable each test using the test builder.
Create a new test with the test builder, or select an existing test previously created using the test builder.
Select the Cloud APM option on the test builder sidebar to enable the integration for the test.
Configure Azure export in the k6 script
If you script your k6 tests, you can also configure the Cloud APM settings using the apm option in the k6 script.
The parameters to export the k6 metrics to Azure Monitor are as follows:
Configuration Parameters
| Name | Description |
|---|---|
| provider(required) | For this integration, the value must be azuremonitor. |
| remoteWriteURL(required) | URL of the Prometheus remote write endpoint. The prometheus_server query param must be included. The license key can optionally be included using the X-License-Key query param. |
| tenantId(required) | The tenantId provided by service principal. The directory (tenant) ID can be extracted from Azure's app registrations. |
| clientId(required) | The clientId provided by service principal. The application (client) ID can be extracted from Azure's app registrations. |
| clientSecret(required) | The clientSecret provided by service principal. The client secret can be extracted from the certificates & secrets section of Azure's app registrations. |
| subscriptionId(required) | The subscriptionId can be viewed in the subscriptions section of Azure portal. |
| resourceGroupName(required) | The resourceGroupName can be viewed in the resource groups section of Azure portal. It should match the subscriptionId. |
| insightsAppName(required) | The insightsAppName can be viewed in the application insights section of Azure portal. It should match the resourceGroupName. |
| azureRegion | The azureRegion you've created your Azure configurations. See the list of supported regions. Default is eastus. |
| includeDefaultMetrics | Whether it exports the default APM metrics: data_sent, data_received, http_req_duration, http_reqs, iterations, and vus. Default is true. |
| metrics | List of metrics to export. A subsequent section details how to specify metrics. |
| includeTestRunId | Whether all the exported metrics include a test_run_id tag whose value is the k6 Cloud test run id. Default is false. Be aware that enabling this setting might increase the cost of your APM provider. |
| resampleRate | Sampling period for metrics in seconds. Default is 60, as Azure Monitor aggregates metrics in 1 minute periods. |
Metric configuration
Each entry in metrics parameter can be an object with following keys:
| Name | Description |
|---|---|
| sourceMetric(required) | Name of k6 builtin or custom metric to export, optionally with tag filters. Tag filtering follows Prometheus selector syntax, Example: http_reqs{name="http://example.com",status!="500"} |
| targetMetric | Name of resulting metric in Azure Monitor. Default is the name of the source metric. Example: http_reqs |
| keepTags | List of tags to preserve when exporting time series. |
keepTags can have a high cost
Most cloud platforms charge clients based on the number of time series stored.
When exporting a metric, every combination of kept-tag values becomes a distinct time series in Prometheus. While this granularity can help test analysis, it will incur high costs with thousands of time series
For example, if you add keepTags: ["name"] on http_* metrics, and your load test calls many dynamic URLs, the number of produced time series can build up very quickly. Refer to URL Grouping for how to reduce the value count for a name tag.
k6 recommends exporting only tags that are necessary and don't have many distinct values.
Metric configuration detailed example
Read more
Supported Regions
The supported Azure Monitor regions are:
| Geographic Region | Supported Azure Region(s) |
|---|---|
| Africa | southafricanorth, southafricawest |
| America | brazilsouth, canadacentral, canadaeast, centralus, eastus (default), eastus2, northcentralus, southcentralus, westcentralus, westus, westus2 |
| Asia | centralindia, eastasia, japaneast, japanwest, koreacentral, koreasouth, southeastasia, southlindia, uaecentral, uaenorth, westindia |
| Australia | australiacentral, australiacentral2, australiaeast, australiasoutheast |
| Europe | francecentral, francesouth, northeurope, uksouth, ukwest, westeurope |
Necessary Azure values
To set up the Azure Monitor integration on the k6 Cloud, you need the following settings:
| Name | Description |
|---|---|
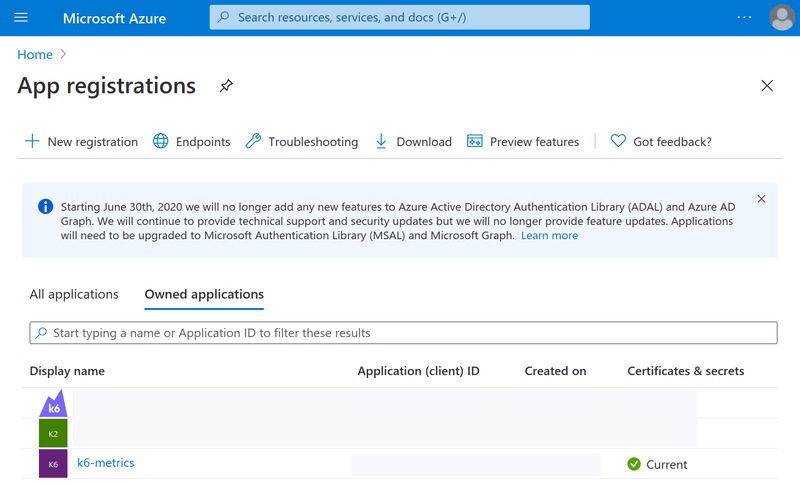
| tenantId | The tenantId provided by service principal. The directory (tenant) ID can be extracted from Azure's app registrations. |
| clientId | The clientId provided by service principal. The application (client) ID can be extracted from Azure's app registrations. |
| clientSecret | The clientSecret provided by service principal. The client secret can be extracted from the certificates & secrets section of Azure's app registrations. |
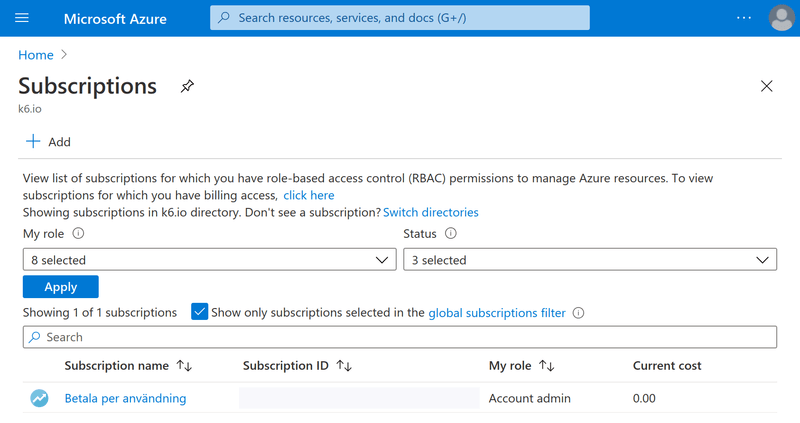
| subscriptionId | The subscriptionId can be viewed in the subscriptions section of Azure portal. |
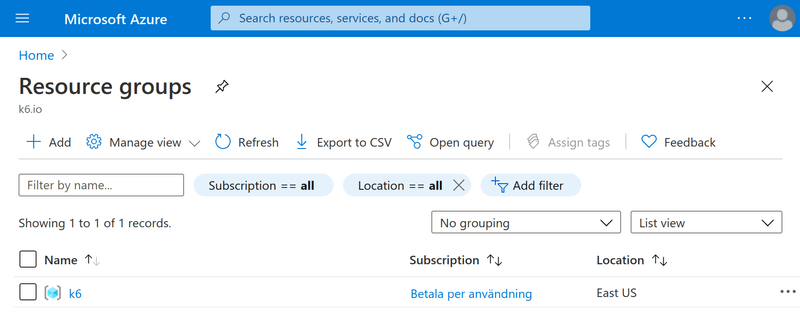
| resourceGroupName | The resourceGroupName can be viewed in the resource groups section of Azure portal. It should match the subscriptionId. |
| insightsAppName | The insightsAppName can be viewed in the application insights section of Azure portal. It should match the resourceGroupName. |
| azureRegion | The azureRegion you've created your Azure configurations. See the list of supported regions. Default is eastus. |
You can follow these instructions to get the required Azure Monitor settings. You'll need to paste each value into the Test Builder fields or your test script.
Make sure you have an active subscription on Azure. Copy the subscriptionId value.
Create a resource group under your active subscription. Copy the resourceGroupName.
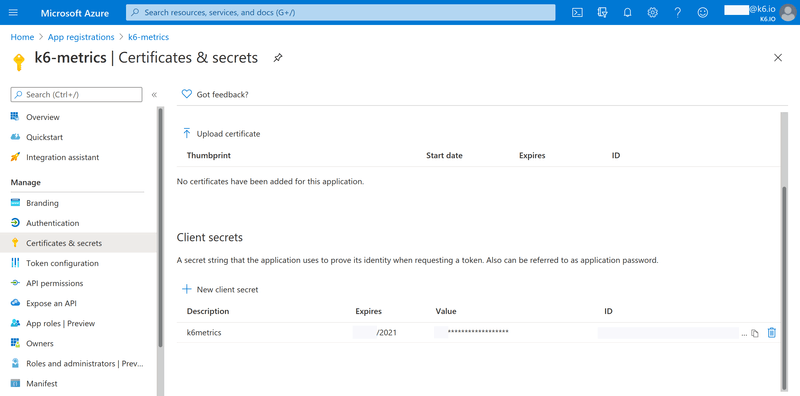
Create a service principal by adding a new app to Azure app registrations. Copy the tenantId.
Create a client secret in your service principal. Copy the clientId and clientSecret settings.
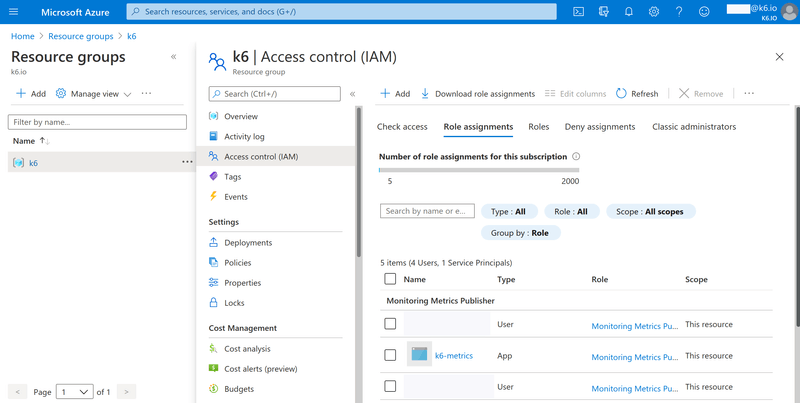
Go to your resource group and assign the Monitoring Metrics Publisher role to the user and service principal.
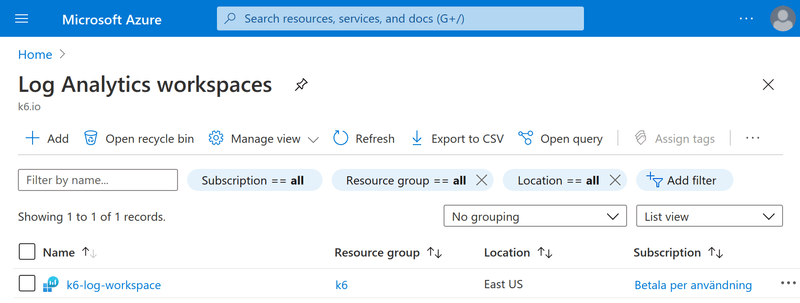
Create a log analytics workspace.
The region is now created. Copy the region name for the azureRegion setting.
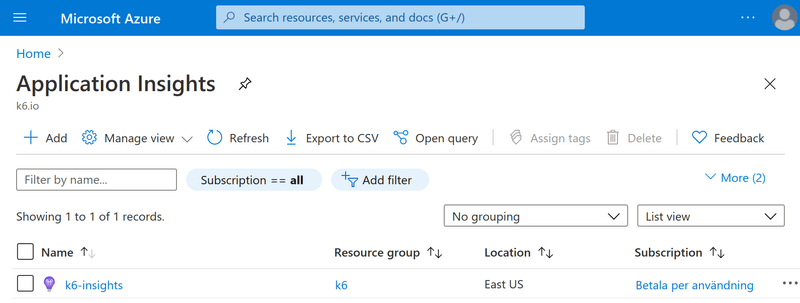
Create an app under application insights with your log analytics workspace. The region should match the log analytics workspace. Copy the app name for the insightsAppName setting.
Run the cloud test
After you configure the Azure Monitor settings in the test, you can run a cloud test as usual. k6 Cloud will continuously export the test-result metrics to Azure Monitor during the test execution with a 3~4 minutes delay.
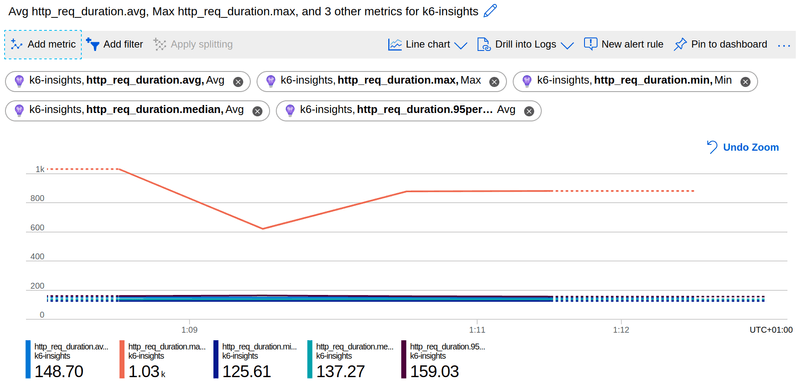
You can now view the k6 metrics on Azure Monitor. Just choose application insights as scope, k6 as metrics namespace, and your metrics (and their associated aggregation methods) will be shown in the metric dropdown. If you don't see the results, try to narrow down the time range to last 30 minutes or less.
