If your test is on an HTTP service, you'll often want to search through the requests that the test made to find significant values.
Granular HTTP data
Each HTTP request and response contains valuable data for a tester. Depending on your case, you may want to inspect HTTP requests by different metrics. For example, you might want to organize the test resources:
- most requested
- longest p95 times
- most failed
If you want to see HTTP trends, you can use the HTTP tab to visualize results.
Then, you can explore the individual requests.
Explore HTTP requests in cloud results
In k6 Cloud, you can use the HTTP tab to inspect individual requests in your test.
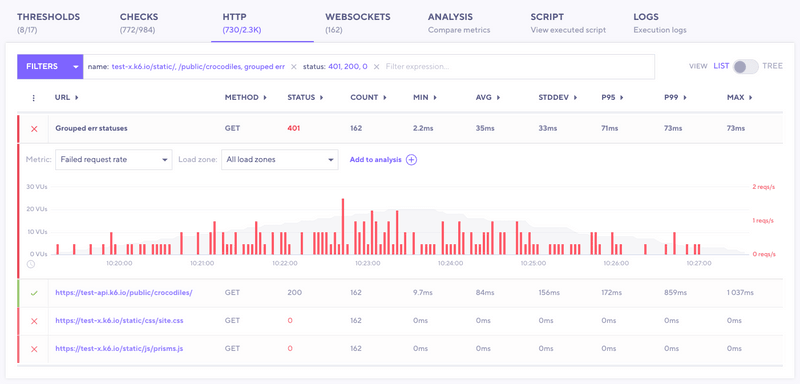
First, in the tab itself, note the number of HTTP requests that passed against the total number of requests. This number provides a quick, top-level overview of test performance.
The HTTP tab shows a row for each HTTP request, with columns for resource, test scenario, method used, and status code returned.
To filter the requests, use the search bar to filter by name, status, etc.
To inspect a request in detail:
- Select its row.
- In the expanded row, inspect the:
- Additional metrics for the request
- Options to change the aggregation
- To see HTTP metrics from a specific load zone, use the drop down.
If you want to compare an HTTP time series to other data, add it to the Analysis ta.
Compare HTTP metrics with other time series
To compare the request, and its metrics, with other data about the test:
- Select the row.
- Select Add to analysis.
- Then use the Analysis tab to find correlations between threshold data and other values from the test.
Organize HTTP requests by scenario and group
The HTTP tab can display two different views:
- The list view shows a flat list of entries. You can use the columns to sort by label name, status, method, and expected_response.
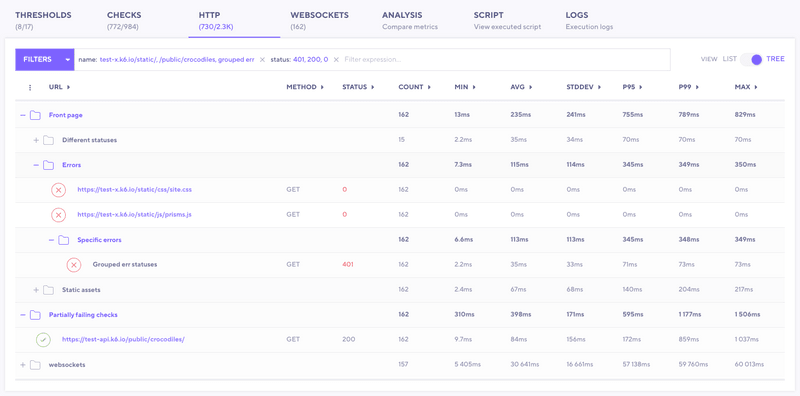
- The tree view organizes entries by the scenario and group from which the request was sent.
To change the tab to tree view, use the toggle.
To sort trees by a metric, select the caret at the top of the column.
To explore a specific node for a scenario or group, uncollapse the resource.
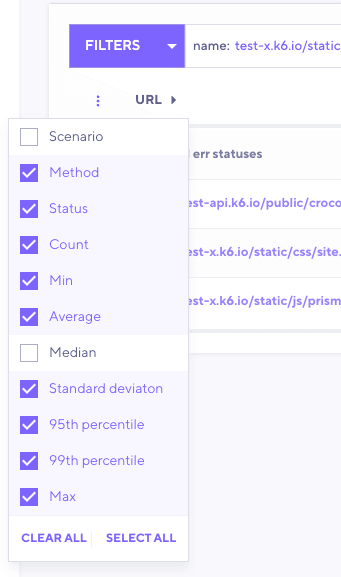
To customize what metrics and resources are displayed, use the vertical-ellipses (or "kebab") icon at the beginning of the heading row. With this icon, you hide columns or show new columns.


